Answered step by step
Verified Expert Solution
Question
1 Approved Answer
Perform a correlation analysis among the cost drivers. That is, you should compute the correlation between every pair of the cost driver. Identify the pairs
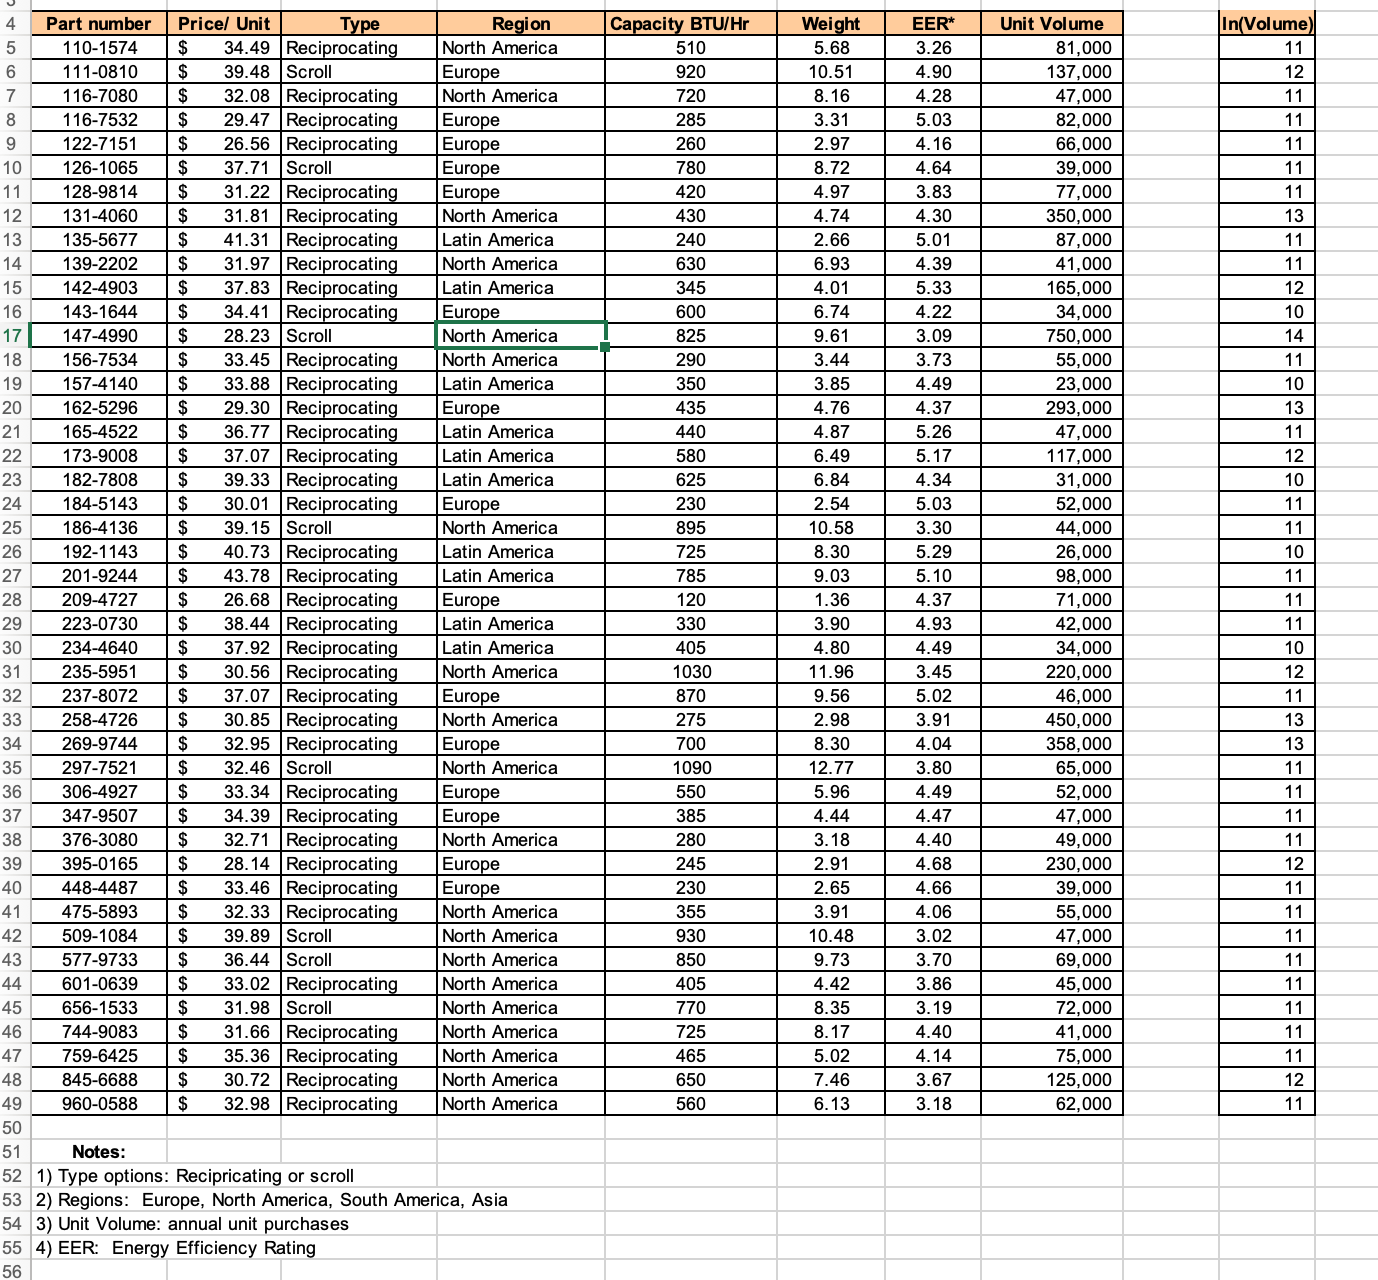
Perform a correlation analysis among the cost drivers. That is, you should compute the correlation between every pair of the cost driver. Identify the pairs of cost drivers that have an absolute value of correlation above 0.6. You can use the Excel function CORREL(arry1, array2) or use the menu Data->Data Analysis->Correlation Analysis to compute the correlation. Please provide step by step instructions on how to go about performing this correlation analysis.
 \begin{tabular}{|r|} \hline In(Volume) \\ \hline 11 \\ \hline 12 \\ \hline 11 \\ \hline 11 \\ \hline 11 \\ \hline 11 \\ \hline 11 \\ \hline 13 \\ \hline 11 \\ \hline 11 \\ \hline 12 \\ \hline 10 \\ \hline 14 \\ \hline 11 \\ \hline 10 \\ \hline 13 \\ \hline 11 \\ \hline 12 \\ \hline 10 \\ \hline 11 \\ \hline 11 \\ \hline 10 \\ \hline 11 \\ \hline 11 \\ \hline 11 \\ \hline 10 \\ \hline 12 \\ \hline 11 \\ \hline 13 \\ \hline 13 \\ \hline 11 \\ \hline 11 \\ \hline 11 \\ \hline 11 \\ \hline 12 \\ \hline 11 \\ \hline 11 \\ \hline 11 \\ \hline 11 \\ \hline 11 \\ \hline 11 \\ \hline 11 \\ \hline \end{tabular} Notes: 1) Type options: Recipricating or scroll 2) Regions: Europe, North America, South America, Asia 3) Unit Volume: annual unit purchases 4) EER: Energy Efficiency Rating \begin{tabular}{|r|} \hline In(Volume) \\ \hline 11 \\ \hline 12 \\ \hline 11 \\ \hline 11 \\ \hline 11 \\ \hline 11 \\ \hline 11 \\ \hline 13 \\ \hline 11 \\ \hline 11 \\ \hline 12 \\ \hline 10 \\ \hline 14 \\ \hline 11 \\ \hline 10 \\ \hline 13 \\ \hline 11 \\ \hline 12 \\ \hline 10 \\ \hline 11 \\ \hline 11 \\ \hline 10 \\ \hline 11 \\ \hline 11 \\ \hline 11 \\ \hline 10 \\ \hline 12 \\ \hline 11 \\ \hline 13 \\ \hline 13 \\ \hline 11 \\ \hline 11 \\ \hline 11 \\ \hline 11 \\ \hline 12 \\ \hline 11 \\ \hline 11 \\ \hline 11 \\ \hline 11 \\ \hline 11 \\ \hline 11 \\ \hline 11 \\ \hline \end{tabular} Notes: 1) Type options: Recipricating or scroll 2) Regions: Europe, North America, South America, Asia 3) Unit Volume: annual unit purchases 4) EER: Energy Efficiency Rating
 Step by Step Solution
There are 3 Steps involved in it
Step: 1

Get Instant Access to Expert-Tailored Solutions
See step-by-step solutions with expert insights and AI powered tools for academic success
Step: 2

Step: 3

Ace Your Homework with AI
Get the answers you need in no time with our AI-driven, step-by-step assistance
Get Started


