Perform a financial ratio analysis' for the Digby company using the information below. Please show your work.
Post your calculations to as many of the financial ratios that you can.
Discuss how the Digby company is doing against its competitors.
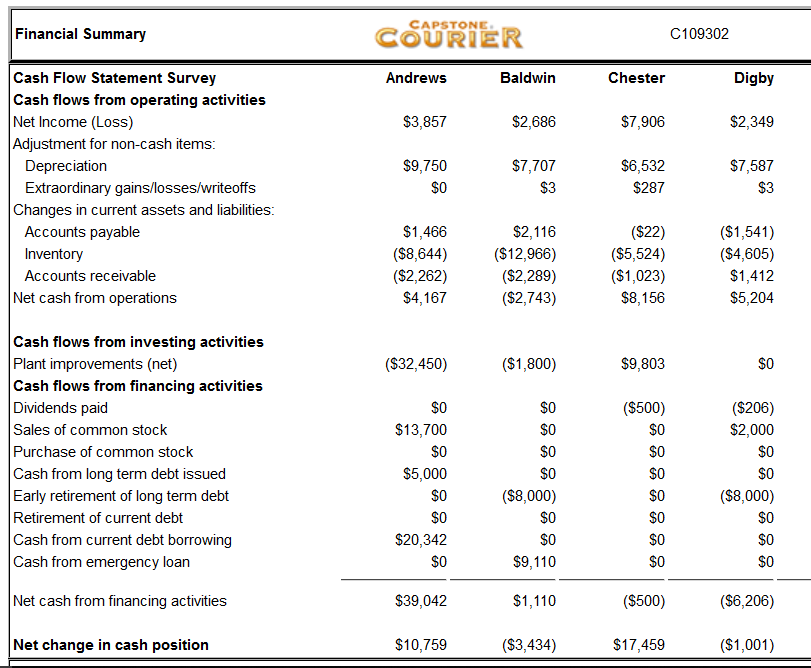
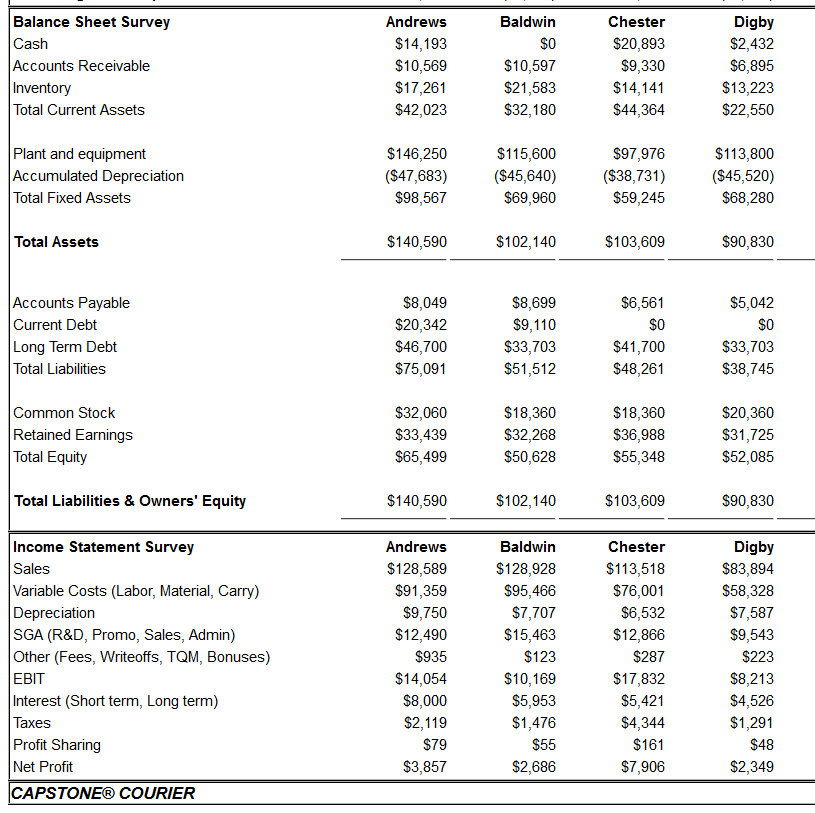
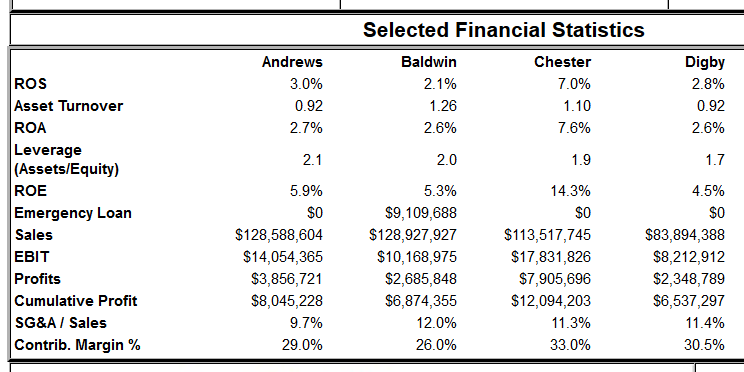
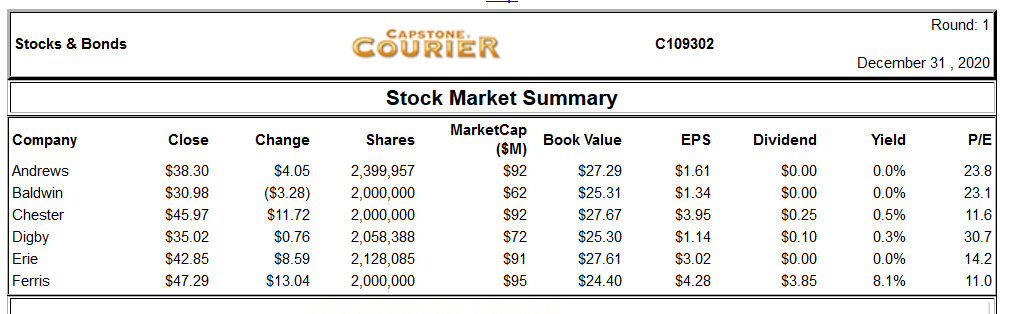
L Financial Summary COURIER C109302 Andrews Baldwin Chester Digby $3,857 $2,686 $7,906 $2,349 $9,750 $7,587 Cash Flow Statement Survey Cash flows from operating activities Net Income (Loss) Adjustment for non-cash items: Depreciation Extraordinary gains/losses/writeoffs Changes in current assets and liabilities: Accounts payable Inventory Accounts receivable Net cash from operations $7,707 $3 $6,532 $287 $0 $1,466 ($8,644) ($2,262) $4,167 $2,116 ($12,966) ($2,289) ($2,743) ($22) ($5,524) ($1,023) $8,156 ($1,541) ($4,605) $1,412 $5,204 ($32,450) ($1,800) $9,803 $0 ($500) Cash flows from investing activities Plant improvements (net) Cash flows from financing activities Dividends paid Sales of common stock Purchase of common stock Cash from long term debt issued Early retirement of long term debt Retirement of current debt Cash from current debt borrowing Cash from emergency loan $13,700 $0 $5,000 $0 ($206) $2,000 $0 $0 ($8,000) $0 $0 1 f*******|| $0 $0 50 ($8,000) $0 $0 $9,110 $0 $20,342 $0 $0 $0 $0 $0 Net cash from financing activities $39,042 $1,110 ($500) ($6,206) Net change in cash position $10,759 ($3,434) $17,459 ($1,001) Baldwin $O Balance Sheet Survey Cash Accounts Receivable Inventory Total Current Assets Andrews $14,193 $10,569 $17,261 $42,023 $10,597 $21,583 $32,180 Chester $20,893 $9,330 $14,141 $44,364 Digby $2,432 $6,895 $13,223 $22,550 Plant and equipment Accumulated Depreciation Total Fixed Assets $146,250 ($47,683) $98,567 $115,600 ($45,640) $69,960 $97,976 ($38,731) $59,245 $113,800 ($45,520) $68,280 Total Assets $140,590 $102,140 $103,609 $90,830 $5,042 $0 Accounts Payable Current Debt Long Term Debt Total Liabilities $8,049 $20,342 $46.700 $75,091 $8,699 $9,110 $33,703 $51,512 $6,561 $0 $41,700 $48,261 $33,703 $38,745 Common Stock Retained Earnings Total Equity $32,060 $33,439 $65,499 $18,360 $32,268 $50,628 $18,360 $36,988 $55,348 $20,360 $31,725 $52,085 Total Liabilities & Owners' Equity $140,590 $102, 140 $103,609 $90,830 Income Statement Survey Sales Variable Costs (Labor, Material, Carry) Depreciation SGA (R&D, Promo, Sales, Admin) Other (Fees, Writeoffs, TQM, Bonuses) EBIT Interest (Short term, Long term) Taxes Profit Sharing Net Profit CAPSTONE COURIER Andrews $128,589 $91,359 $9,750 $12,490 $935 $14,054 $8,000 $2,119 $79 $3,857 Baldwin $128,928 $95,466 $7,707 $15.463 $123 $10,169 $5,953 $1,476 $55 $2,686 Chester $113,518 $76.001 $6,532 $12,866 $287 $17,832 $5,421 $4,344 $161 $7,906 Digby $83,894 $58,328 $7,587 $9,543 $223 $8.213 $4,526 $1,291 $48 $2,349 Selected Financial Statistics Andrews 3.0% 0.92 Baldwin 2.1% 1.26 2.6% Chester 7.0% 1.10 Digby 2.8% 0.92 2.6% 2.7% 7.6% 2.1 2.0 1.9 1.7 5.9% 14.3% 4.5% ROS Asset Turnover ROA Leverage (Assets/Equity) ROE Emergency Loan Sales EBIT Profits Cumulative Profit SG&A / Sales Contrib. Margin % $0 $0 $128,588,604 $14,054,365 $3,856,721 $8,045,228 9.7% 29.0% 5.3% $9,109,688 $128,927,927 $10,168,975 $2,685,848 $6,874,355 12.0% 26.0% $113,517,745 $17,831,826 $7,905 696 $12,094,203 11.3% 33.0% $83,894,388 $8,212,912 $2.348.789 $6,537,297 11.4% 30.5% Round: 1 Stocks & Bonds CAPSTONE COURIER C109302 December 31, 2020 Stock Market Summary Company Close Shares Book Value Dividend Yield PIE MarketCap ($M) $92 23.8 23.1 Andrews Baldwin Chester Digby Erie Ferris Change $4.05 ($3.28) $11.72 $0.76 $8.59 $13.04 $38.30 $30.98 $45.97 $35.02 $42.85 $47.29 11.6 2,399,957 2,000,000 2,000,000 2,058,388 2,128,085 2,000,000 EPS $1.61 $1.34 $3.95 $1.14 $3.02 $4.28 $27.29 $25.31 $27.67 $25.30 $27.61 $24.40 $0.00 $0.00 $0.25 $0.10 $0.00 $3.85 0.0% 0.0% 0.5% 0.3% 0.0% 8.1% 30.7 $91 $95 14.2 11.0 L Financial Summary COURIER C109302 Andrews Baldwin Chester Digby $3,857 $2,686 $7,906 $2,349 $9,750 $7,587 Cash Flow Statement Survey Cash flows from operating activities Net Income (Loss) Adjustment for non-cash items: Depreciation Extraordinary gains/losses/writeoffs Changes in current assets and liabilities: Accounts payable Inventory Accounts receivable Net cash from operations $7,707 $3 $6,532 $287 $0 $1,466 ($8,644) ($2,262) $4,167 $2,116 ($12,966) ($2,289) ($2,743) ($22) ($5,524) ($1,023) $8,156 ($1,541) ($4,605) $1,412 $5,204 ($32,450) ($1,800) $9,803 $0 ($500) Cash flows from investing activities Plant improvements (net) Cash flows from financing activities Dividends paid Sales of common stock Purchase of common stock Cash from long term debt issued Early retirement of long term debt Retirement of current debt Cash from current debt borrowing Cash from emergency loan $13,700 $0 $5,000 $0 ($206) $2,000 $0 $0 ($8,000) $0 $0 1 f*******|| $0 $0 50 ($8,000) $0 $0 $9,110 $0 $20,342 $0 $0 $0 $0 $0 Net cash from financing activities $39,042 $1,110 ($500) ($6,206) Net change in cash position $10,759 ($3,434) $17,459 ($1,001) Baldwin $O Balance Sheet Survey Cash Accounts Receivable Inventory Total Current Assets Andrews $14,193 $10,569 $17,261 $42,023 $10,597 $21,583 $32,180 Chester $20,893 $9,330 $14,141 $44,364 Digby $2,432 $6,895 $13,223 $22,550 Plant and equipment Accumulated Depreciation Total Fixed Assets $146,250 ($47,683) $98,567 $115,600 ($45,640) $69,960 $97,976 ($38,731) $59,245 $113,800 ($45,520) $68,280 Total Assets $140,590 $102,140 $103,609 $90,830 $5,042 $0 Accounts Payable Current Debt Long Term Debt Total Liabilities $8,049 $20,342 $46.700 $75,091 $8,699 $9,110 $33,703 $51,512 $6,561 $0 $41,700 $48,261 $33,703 $38,745 Common Stock Retained Earnings Total Equity $32,060 $33,439 $65,499 $18,360 $32,268 $50,628 $18,360 $36,988 $55,348 $20,360 $31,725 $52,085 Total Liabilities & Owners' Equity $140,590 $102, 140 $103,609 $90,830 Income Statement Survey Sales Variable Costs (Labor, Material, Carry) Depreciation SGA (R&D, Promo, Sales, Admin) Other (Fees, Writeoffs, TQM, Bonuses) EBIT Interest (Short term, Long term) Taxes Profit Sharing Net Profit CAPSTONE COURIER Andrews $128,589 $91,359 $9,750 $12,490 $935 $14,054 $8,000 $2,119 $79 $3,857 Baldwin $128,928 $95,466 $7,707 $15.463 $123 $10,169 $5,953 $1,476 $55 $2,686 Chester $113,518 $76.001 $6,532 $12,866 $287 $17,832 $5,421 $4,344 $161 $7,906 Digby $83,894 $58,328 $7,587 $9,543 $223 $8.213 $4,526 $1,291 $48 $2,349 Selected Financial Statistics Andrews 3.0% 0.92 Baldwin 2.1% 1.26 2.6% Chester 7.0% 1.10 Digby 2.8% 0.92 2.6% 2.7% 7.6% 2.1 2.0 1.9 1.7 5.9% 14.3% 4.5% ROS Asset Turnover ROA Leverage (Assets/Equity) ROE Emergency Loan Sales EBIT Profits Cumulative Profit SG&A / Sales Contrib. Margin % $0 $0 $128,588,604 $14,054,365 $3,856,721 $8,045,228 9.7% 29.0% 5.3% $9,109,688 $128,927,927 $10,168,975 $2,685,848 $6,874,355 12.0% 26.0% $113,517,745 $17,831,826 $7,905 696 $12,094,203 11.3% 33.0% $83,894,388 $8,212,912 $2.348.789 $6,537,297 11.4% 30.5% Round: 1 Stocks & Bonds CAPSTONE COURIER C109302 December 31, 2020 Stock Market Summary Company Close Shares Book Value Dividend Yield PIE MarketCap ($M) $92 23.8 23.1 Andrews Baldwin Chester Digby Erie Ferris Change $4.05 ($3.28) $11.72 $0.76 $8.59 $13.04 $38.30 $30.98 $45.97 $35.02 $42.85 $47.29 11.6 2,399,957 2,000,000 2,000,000 2,058,388 2,128,085 2,000,000 EPS $1.61 $1.34 $3.95 $1.14 $3.02 $4.28 $27.29 $25.31 $27.67 $25.30 $27.61 $24.40 $0.00 $0.00 $0.25 $0.10 $0.00 $3.85 0.0% 0.0% 0.5% 0.3% 0.0% 8.1% 30.7 $91 $95 14.2 11.0