Perform a financial ratio analysis on Southwest Airlines. Complete the following steps and utilize the attached table outline.
Use the pertinent data on your company to complete the Historical Ratios Table in your Strategic-Planning Template.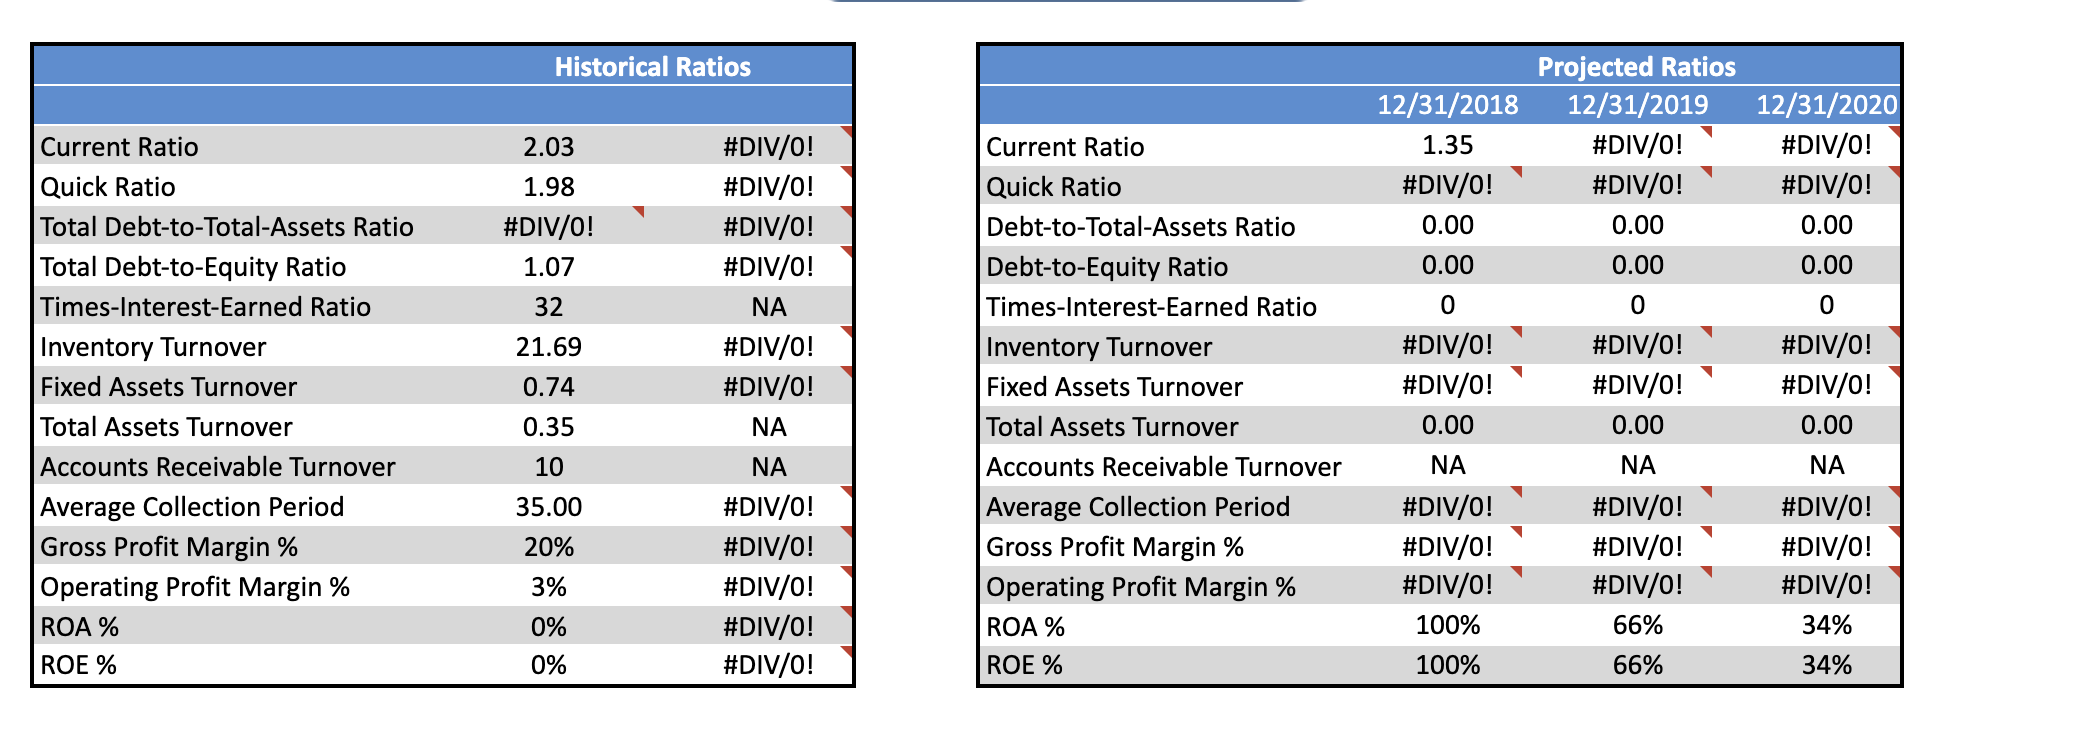 In 500-750 words, prepare a report of the research information being sure to discuss what the findings mean regarding strategy creation.
Historical Ratios 2.03 1.98 #DIV/0! 1.07 12/31/2018 1.35 #DIV/0! 0.00 0.00 0 #DIV/0! #DIV/0! 0.00 Current Ratio Quick Ratio Total Debt-to-Total-Assets Ratio Total Debt-to-Equity Ratio Times-Interest-Earned Ratio Inventory Turnover Fixed Assets Turnover Total Assets Turnover Accounts Receivable Turnover Average Collection Period Gross Profit Margin % Operating Profit Margin % ROA % ROE % 32 Projected Ratios 12/31/2019 #DIV/0! #DIV/0! 0.00 0.00 0 #DIV/0! #DIV/0! 0.00 #DIV/0! #DIV/0! #DIV/0! #DIV/0! NA #DIV/0! #DIV/0! NA NA #DIV/0! #DIV/0! #DIV/0! #DIV/0! #DIV/0! 21.69 12/31/2020 #DIV/0! #DIV/0! 0.00 0.00 0 #DIV/0! #DIV/0! 0.00 Current Ratio Quick Ratio Debt-to-Total-Assets Ratio Debt-to-Equity Ratio Times-Interest-Earned Ratio Inventory Turnover Fixed Assets Turnover Total Assets Turnover Accounts Receivable Turnover Average Collection Period Gross Profit Margin % Operating Profit Margin % ROA % ROE % 0.74 0.35 10 NA NA NA 35.00 20% #DIV/0! #DIV/0! #DIV/0! 100% #DIV/0! #DIV/0! #DIV/0! 66% #DIV/0! #DIV/0! #DIV/0! 34% 3% 0% 0% 100% 66% 34% Historical Ratios 2.03 1.98 #DIV/0! 1.07 12/31/2018 1.35 #DIV/0! 0.00 0.00 0 #DIV/0! #DIV/0! 0.00 Current Ratio Quick Ratio Total Debt-to-Total-Assets Ratio Total Debt-to-Equity Ratio Times-Interest-Earned Ratio Inventory Turnover Fixed Assets Turnover Total Assets Turnover Accounts Receivable Turnover Average Collection Period Gross Profit Margin % Operating Profit Margin % ROA % ROE % 32 Projected Ratios 12/31/2019 #DIV/0! #DIV/0! 0.00 0.00 0 #DIV/0! #DIV/0! 0.00 #DIV/0! #DIV/0! #DIV/0! #DIV/0! NA #DIV/0! #DIV/0! NA NA #DIV/0! #DIV/0! #DIV/0! #DIV/0! #DIV/0! 21.69 12/31/2020 #DIV/0! #DIV/0! 0.00 0.00 0 #DIV/0! #DIV/0! 0.00 Current Ratio Quick Ratio Debt-to-Total-Assets Ratio Debt-to-Equity Ratio Times-Interest-Earned Ratio Inventory Turnover Fixed Assets Turnover Total Assets Turnover Accounts Receivable Turnover Average Collection Period Gross Profit Margin % Operating Profit Margin % ROA % ROE % 0.74 0.35 10 NA NA NA 35.00 20% #DIV/0! #DIV/0! #DIV/0! 100% #DIV/0! #DIV/0! #DIV/0! 66% #DIV/0! #DIV/0! #DIV/0! 34% 3% 0% 0% 100% 66% 34%