Perform a Horizontal and Vertical Analysis of the financial statements and ratios using the below information and calculate the changes


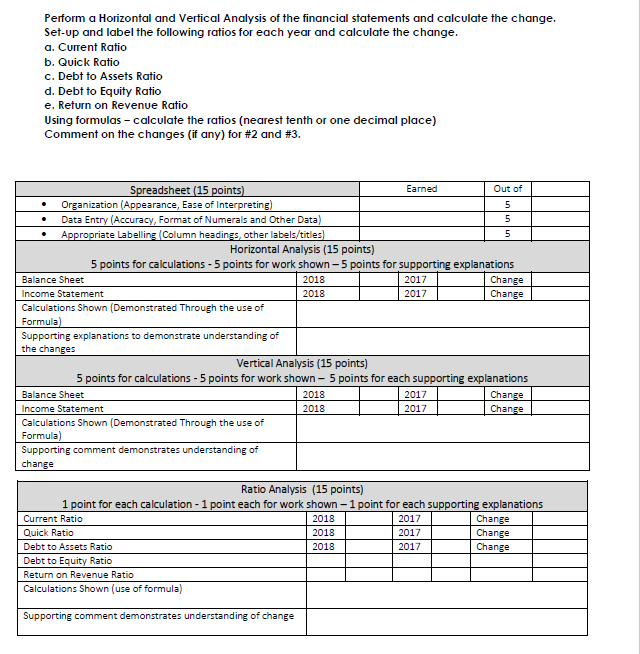
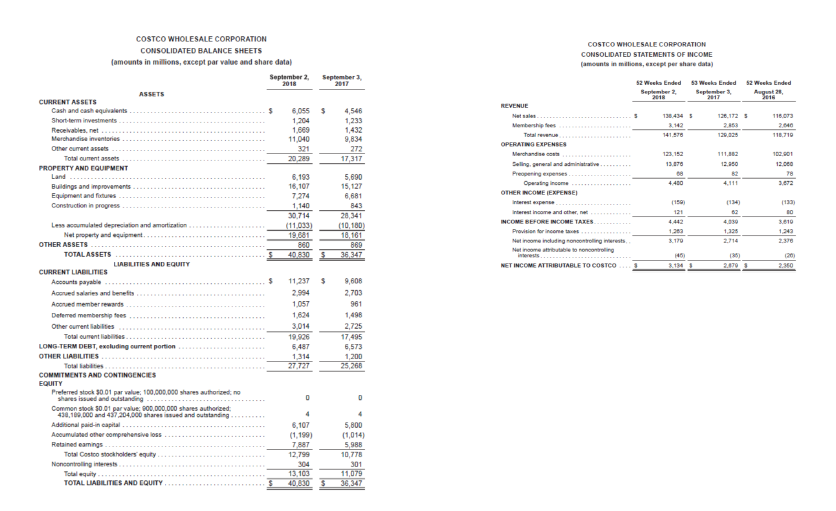
Perform a Horizontal and Vertical Analysis of the financial statements and calculate the change. Set-up and label the following ratios for each year and calculate the change. a. Current Ratio b. Quick Ratio c. Debt to Assets Ratio d. Debt to Equity Ratio e. Return on Revenue Ratio Using formulas - calculate the ratios (nearest tenth or one decimal place) Comment on the changes (if any) for #2 and #3. Spreadsheet (15 points) Earned Out of Organization (Appearance, Ease of Interpreting) 5 Data Entry (Accuracy, Format of Numerals and Other Data) 5 Appropriate Labelling Column headings, other labels/titles) 5 Horizontal Analysis (15 points) 5 points for calculations - 5 points for work shown 5 points for supporting explanations Balance Sheet 2018 2017 Change Income Statement 2018 2017 Change Calculations Shown (Demonstrated Through the use of Formula) Supporting explanations to demonstrate understanding of the changes Vertical Analysis (15 points) 5 points for calculations - 5 points for work shown 5 points for each supporting explanations Balance Sheet 2018 2017 Change Income Statement 2018 2017 Change Calculations Shown (Demonstrated Through the use of Formula) Supporting comment demonstrates understanding of change Ratio Analysis (15 points) 1 point for each calculation - 1 point each for work shown - 1 point for each supporting explanations Current Ratio 2018 2017 Change Quick Ratio 2018 2017 Change Debt to Assets Ratio 2018 2017 Change Debt to Equity Ratio Return on Revenue Ratio Calculations Shown (use of formula) Supporting comment demonstrates understanding of change COSTCO WHOLESALE CORPORATION CONSOLIDATED STATEMENTS OF INCOME amountain milions, except per share data) 52 Week Ended 3 Week Ended 52 Week Ended September September 2017 August 2 2016 REVENUE 138,454 128,1725 2.53 Membership fees Totale OPERATING EXPENSES 118.093 2.046 118.710 141.578 123. 152 100.000 12.00 78 Dellingen die Preopening Operating income OTHER INCOME EXPENSE) 4480 1500 1133 3810 1243 interest income and other net INCOME BEFORE INCOME TAXES Provision for income Netcomending on Net income to rocontrolling NET INCOME ATTRIBUTABLE TO COSTCO 1383 3.179 COSTCO WHOLESALE CORPORATION CONSOLIDATED BALANCE SHEETS amounts in millions, except par value and share data) September 2. 2018 September 2017 ASSETS CURRENT ASSETS Cash and cash equivalent 6,0555 Short-term investments 1204 1,233 Receivables.net 1,669 Merchandise inventories 11.040 9,834 Other current assets 272 Total current assets 20.289 17,317 PROPERTY AND EQUIPMENT Land 6.199 5,690 Buildings and improvements 16.107 15,127 Equipment and Pictures 7.274 6,681 Construction in progress 1,140 843 30.714 28,341 Less accumulated depreciation and amortization (11 033) (10,180) Net property and equipment 19.081 18,161 OTHER ASSETS 860 869 TOTAL ASSETS 40.820 36.347 LIABILITIES AND EQUITY CURRENT LIABILITIES Accounts payable 11237 $ 9,608 Acarved salaries and benefits 2.994 2,703 Agored member rewards 1057 961 Deferred membership fres Other current abilities 3.014 2,725 Total currenties 19.926 17.495 LONG-TERM DEBT, sluding current portion 5,573 OTHER LIABILITIES 1,314 1,200 Tewab 27.727 25,268 COMMITMENTS AND CONTINGENCIES EQUITY Preferred stock 5001 par value: 100.000.000 shares authorizetne shares issued and outstanding D Common stock 50.01 par value: 900.000.000 shares authorized 438,100,000 and 457.204,000 shares and outstanding Additional paid in capital... 6.107 5,800 Acumulated other comprehensive loss (1.199) Retained eaming (1,014) 7887 5.98 Total Costco stockholders equity 12.799 10,778 Noncontrolling interests 301 Total equity 13,103 11,079 TOTAL LIABILITIES AND EQUITY 4078305 36.347 1335 2716 45 8114 1200 20 Perform a Horizontal and Vertical Analysis of the financial statements and calculate the change. Set-up and label the following ratios for each year and calculate the change. a. Current Ratio b. Quick Ratio c. Debt to Assets Ratio d. Debt to Equity Ratio e. Return on Revenue Ratio Using formulas - calculate the ratios (nearest tenth or one decimal place) Comment on the changes (if any) for #2 and #3. Spreadsheet (15 points) Earned Out of Organization (Appearance, Ease of Interpreting) 5 Data Entry (Accuracy, Format of Numerals and Other Data) 5 Appropriate Labelling Column headings, other labels/titles) 5 Horizontal Analysis (15 points) 5 points for calculations - 5 points for work shown 5 points for supporting explanations Balance Sheet 2018 2017 Change Income Statement 2018 2017 Change Calculations Shown (Demonstrated Through the use of Formula) Supporting explanations to demonstrate understanding of the changes Vertical Analysis (15 points) 5 points for calculations - 5 points for work shown 5 points for each supporting explanations Balance Sheet 2018 2017 Change Income Statement 2018 2017 Change Calculations Shown (Demonstrated Through the use of Formula) Supporting comment demonstrates understanding of change Ratio Analysis (15 points) 1 point for each calculation - 1 point each for work shown - 1 point for each supporting explanations Current Ratio 2018 2017 Change Quick Ratio 2018 2017 Change Debt to Assets Ratio 2018 2017 Change Debt to Equity Ratio Return on Revenue Ratio Calculations Shown (use of formula) Supporting comment demonstrates understanding of change COSTCO WHOLESALE CORPORATION CONSOLIDATED STATEMENTS OF INCOME amountain milions, except per share data) 52 Week Ended 3 Week Ended 52 Week Ended September September 2017 August 2 2016 REVENUE 138,454 128,1725 2.53 Membership fees Totale OPERATING EXPENSES 118.093 2.046 118.710 141.578 123. 152 100.000 12.00 78 Dellingen die Preopening Operating income OTHER INCOME EXPENSE) 4480 1500 1133 3810 1243 interest income and other net INCOME BEFORE INCOME TAXES Provision for income Netcomending on Net income to rocontrolling NET INCOME ATTRIBUTABLE TO COSTCO 1383 3.179 COSTCO WHOLESALE CORPORATION CONSOLIDATED BALANCE SHEETS amounts in millions, except par value and share data) September 2. 2018 September 2017 ASSETS CURRENT ASSETS Cash and cash equivalent 6,0555 Short-term investments 1204 1,233 Receivables.net 1,669 Merchandise inventories 11.040 9,834 Other current assets 272 Total current assets 20.289 17,317 PROPERTY AND EQUIPMENT Land 6.199 5,690 Buildings and improvements 16.107 15,127 Equipment and Pictures 7.274 6,681 Construction in progress 1,140 843 30.714 28,341 Less accumulated depreciation and amortization (11 033) (10,180) Net property and equipment 19.081 18,161 OTHER ASSETS 860 869 TOTAL ASSETS 40.820 36.347 LIABILITIES AND EQUITY CURRENT LIABILITIES Accounts payable 11237 $ 9,608 Acarved salaries and benefits 2.994 2,703 Agored member rewards 1057 961 Deferred membership fres Other current abilities 3.014 2,725 Total currenties 19.926 17.495 LONG-TERM DEBT, sluding current portion 5,573 OTHER LIABILITIES 1,314 1,200 Tewab 27.727 25,268 COMMITMENTS AND CONTINGENCIES EQUITY Preferred stock 5001 par value: 100.000.000 shares authorizetne shares issued and outstanding D Common stock 50.01 par value: 900.000.000 shares authorized 438,100,000 and 457.204,000 shares and outstanding Additional paid in capital... 6.107 5,800 Acumulated other comprehensive loss (1.199) Retained eaming (1,014) 7887 5.98 Total Costco stockholders equity 12.799 10,778 Noncontrolling interests 301 Total equity 13,103 11,079 TOTAL LIABILITIES AND EQUITY 4078305 36.347 1335 2716 45 8114 1200 20


