

Answered step by step
Verified Expert Solution
Question
1 Approved Answer
perform a multiple regression analysis inside of Microsoft Excel. Perform a multiple regression using the data Use Sales as the Y Range and Social Media,
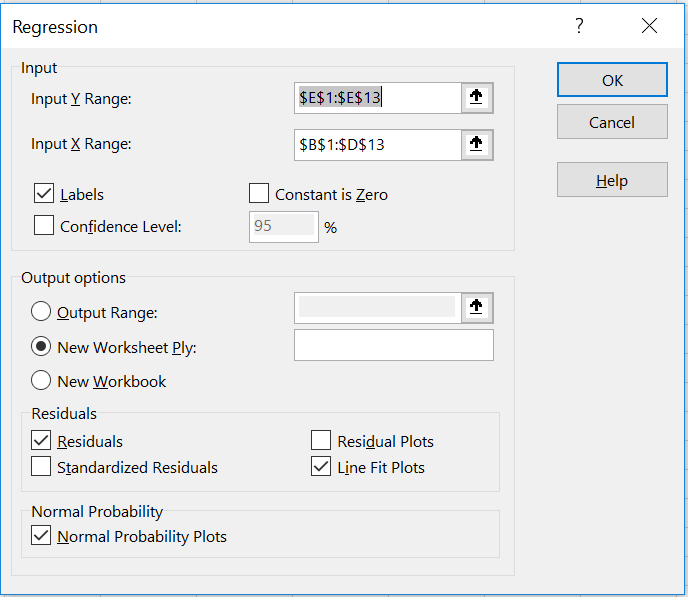
- perform a multiple regression analysis inside of Microsoft Excel.
- Perform a multiple regression using the data "Use Sales" as the Y Range and "Social Media," "Web" and "Print" as the X-Range.
- Include residuals, line-fit plots and Normal probability plots.
Step by Step Solution
There are 3 Steps involved in it
Step: 1

Get Instant Access to Expert-Tailored Solutions
See step-by-step solutions with expert insights and AI powered tools for academic success
Step: 2

Step: 3
Ace Your Homework with AI
Get the answers you need in no time with our AI-driven, step-by-step assistance
Get Started
Essentials of Marketing Research
Authors: Barry J. Babin, William G. Zikmund
6th edition
9781305688094, 1305263472, 1305688090, 978-1305263475