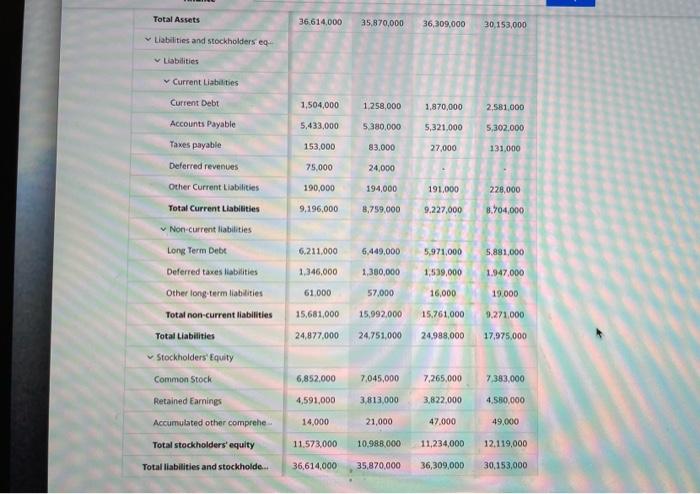
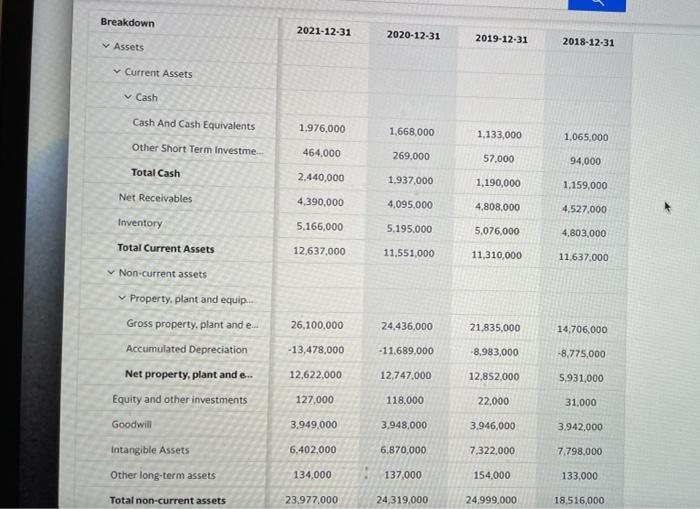
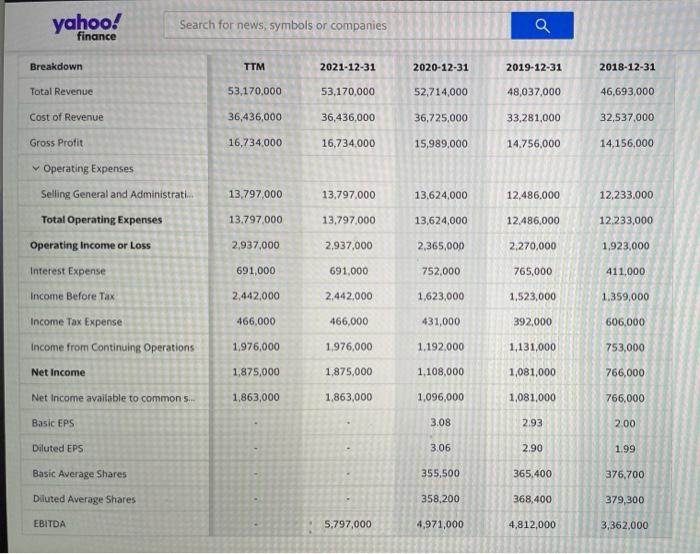
Perform a vertical analysis of Loblaws inc. for 2018,2019, and 2020


Total Assets 36.614,000 35,870,000 36,309,000 30,153,000 Liabilities and stockholders eg. Labilities Current Liabilities Current Debt 1,504,000 1.258,000 1,870,000 2,581,000 Accounts Payable 5,433,000 5380,000 5,321,000 5,302,000 Taxes payable 153,000 83.000 27,000 131,000 75,000 24,000 190,000 194,000 191.000 228.000 9,196,000 8,799,000 9.227,000 8.704,000 6.211.000 6,449,000 5,971,000 5.881,000 Deferred revenues Other Current Liabilities Total Current Liabilities Non current liabilities Long Term Debt Deferred taxes abilities Other long-term liabilities Total non-current liabilities Total Liabilities Stockholders' Equity Common Stock 1.346,000 1.380,000 1,539,000 1.947.000 61.000 57.000 16,000 19.000 15,992,000 15.761,000 15,681,000 24,877,000 9.271.000 17,975.000 24.751.000 24.988,000 6,852.000 7,045,000 7,265,000 7383.000 Retained Earnings 4,591,000 3,813,000 3,822,000 4.580,000 Accumulated other comprehe 14,000 21,000 47.000 49,000 Total stockholders' equity 11.573,000 10,988.000 11,234,000 12.119,000 Total liabilities and stockholde... 36,614,000 35,870,000 36,309,000 30,153,000 Breakdown 2021-12-31 2020-12-31 2019-12-31 Assets 2018-12-31 Current Assets vCash Cash And Cash Equivalents 1,976,000 1,668.000 1,133,000 1,065,000 Other Short Term Investme 464.000 269.000 57.000 94,000 Total Cash 2.440,000 1.937,000 1,190,000 1.159,000 Net Receivables 4,390,000 4,095,000 4,808,000 4.527,000 5.166,000 5.195.000 5.076,000 4,803,000 12,637,000 11,551,000 11,310,000 11.637.000 Inventory Total Current Assets Non-current assets Property, plant and equip. Gross property, plant and e... Accumulated Depreciation 26,200.000 24,436,000 21.835,000 14,706,000 - 13,478,000 -11,689,000 -8,983,000 -8.775.000 Net property, plant and e.. 12,622,000 12,747,000 12,852.000 5,931,000 127,000 118,000 22,000 31,000 Equity and other investments Goodwill 3.949.000 3.948,000 3,946,000 3.942,000 Intangible Assets 6,402,000 6,870,000 7,322,000 7.798,000 Other long-term assets 134,000 137,000 154,000 133,000 Total non-current assets 23.977,000 24,319.000 24.999,000 18.516,000 yahoo! finance Search for news, symbols or companies Breakdown TTM 2021-12-31 2020-12-31 2019-12-31 2018-12-31 Total Revenue 53,170,000 53,170,000 52,714,000 48,037,000 46,693,000 Cost of Revenue 36,436,000 36,436,000 36,725,000 33,281,000 32,537,000 Gross Profit 16,734.000 16,734,000 15,989,000 14.756,000 14,156,000 Operating Expenses 13.797,000 13.797.000 13,624,000 12,486,000 12,233.000 Selling General and Administrati. Total Operating Expenses Operating Income or Loss 13.797.000 13,797.000 13,624,000 12,486,000 12.233,000 2,937,000 2,937,000 2,365,000 2,270,000 1,923,000 Interest Expense 691,000 691,000 752,000 765,000 411,000 Income Before Tax 2,442,000 2.442.000 1,623,000 1,523,000 1.359,000 Income Tax Expense 466,000 466,000 431,000 392,000 606,000 income from Continuing Operations 1,976,000 1,976,000 1.192,000 1,131,000 753,000 Net Income 1,875,000 1.875,000 1,108,000 1,081,000 766,000 Net Income available to commons 1,863,000 1,863,000 1,096,000 1,081,000 766,000 Basic EPS 3.08 2.93 2.00 Diluted EPS 3.06 2.90 1.99 Basic Average Shares 355,500 365.400 376,700 Diluted Average Shares 358,200 368,400 379,300 EBITDA 5,797,000 4,971,000 4,812,000 3,362,000


