

Answered step by step
Verified Expert Solution
Question
1 Approved Answer
Perform a vertical analysis of Metro Inc. Perform a vertical analysis of Metro Inc. for 2018,2019, and 2020 2021 2020 2019 2018 2017 5 year
Perform a vertical analysis of Metro Inc. 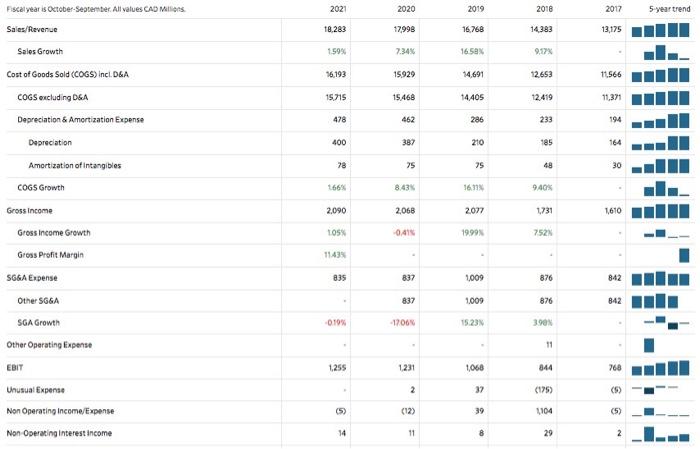
Perform a vertical analysis of Metro Inc. for 2018,2019, and 2020 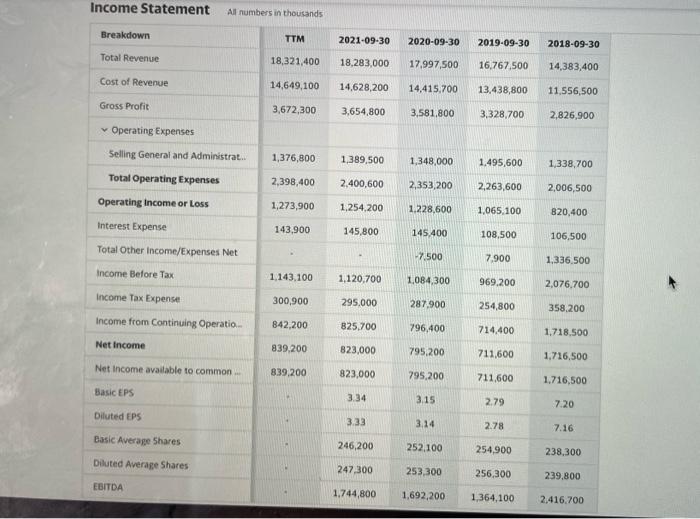
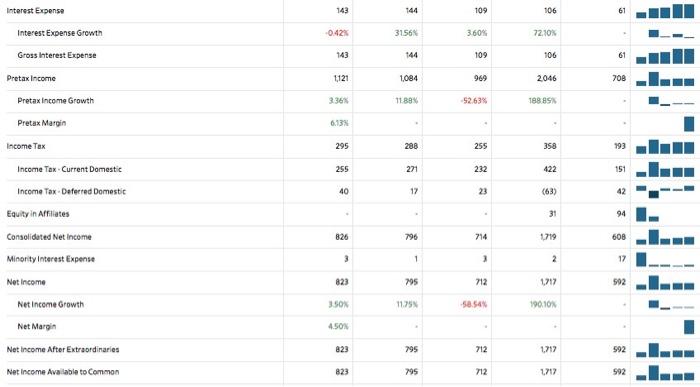
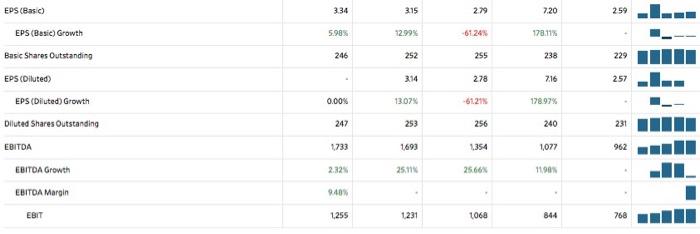
2021 2020 2019 2018 2017 5 year trend Fiscal year is October September. All values CAD Mons. Sales/Revenue 18.283 17,998 16.768 14383 13,175 Sales Growth 1.59% 7.34% 16.50 9.17% 16.193 15.929 14,691 12.653 11566 Cost of Goods Sold (COGS) incl. D&A COGS excluding DGA Depreciation & Amortization Expense 15 715 15468 14405 12.419 11371 478 462 286 233 194 Depreciation 400 387 210 185 164 Amortization of Intangibles 28 75 75 48 30 COGS Growth 166% 8.43 16.31% 940% Gross income 2,090 2,068 2077 1731 1,610 Gross Income Growth LOS 0414 1999 752N 1143 835 837 1009 876 842 837 1009 876 842 -0.19% -1700 15.23 390 Gross Profit Margin SGGA Expense Other SGGA SGA Growth Other Operating expense EBIT Unusual Expense Non Operating Income/Expense Non Operating Interest Income 11 1,255 1231 1,068 844 768 2 37 (175) (5) () (5) (12) 39 1104 (5) 14 11 8 29 Interest Expense 143 144 109 106 61 Interest Expense Growth -0.42% 3156 360% 72.10% Gross interest Expense 143 144 109 106 61 Pretax income 1121 1,084 969 2046 208 Pretax income Growth 336% 1188% 52.63% 188.89 Pretax Margin 6:13 Income Tax 295 288 255 358 193 255 271 232 422 151 40 17 23 (63) 42 31 94 Income Tax Current Domestic Income Tax D Deferred d Domestic Equity in Affiliates Consolidated Net Income Minority interest Expense Net Income Net Income Growth 826 796 714 1719 608 I 3 3 1 3 2 17 823 795 712 1717 592 3.SON 11.79 58.54% 19010 Net Margin 4.50% 823 795 712 1717 592 Net Income After Extraordinaries Net Income Available to Common 823 795 712 1717 592 EPS (Basic) 3:34 3.15 2.79 7.20 259 EPS (Basic) Growth 5.98% 12.99% -6124 178.11% 246 252 255 238 229 3.14 278 7.16 257 Base Shares Outstanding EPS (Diluted) EPS (Diluted) Growth Diluted Shares Outstanding EBITDA 0.00% 13.07% -6127 178.97% 247 253 256 240 231 1733 1693 1354 1077 962 EBITDA Growth 2.32 25.11 25.66% 1190 EBITDA Margin 9.40 EBIT 1.255 1231 1068 844 768 Income Statement All numbers in thousands Breakdown TTM 2021-09-30 2020-09-30 2019-09-30 2018-09-30 Total Revenue 18,321,400 18,283,000 17,997,500 16.767,500 14,383,400 Cost of Revenue 14,649,100 14,628,200 14.415.700 13,438,800 11.556,500 Gross Profit 3,672,300 3,654,800 3.581.800 3,328,700 2,826,900 Operating Expenses 1,376,800 1,389,500 1,348,000 1.495,600 1,338,700 2,398,400 Selling General and Administrat.. Total Operating Expenses Operating Income or Loss Interest Expense 2.400,600 2,353,200 2,263,600 2,006,500 1,273,900 1.254.200 1.228,600 1,065,100 820,400 143.900 145,800 145.400 108,500 106,500 Total Other Income/Expenses Net 7.500 7.900 1.336.500 1.143.100 1,120,700 1,084,300 969.200 2,076,700 300,900 295.000 Income Before Tax Income Tax Expense Income from Continuing Operatio.. Net Income 287.900 254,800 358,200 842,200 825.700 796,400 714,400 1.718.500 839.200 823,000 795,200 711,600 1,716,500 Net Income available to common 839,200 823,000 795,200 711,600 1,716,500 Basic EPS 334 3.15 2.79 7.20 Diluted EPS 3.33 3.14 2.78 7.16 Basic Average Shares 246,200 252.100 254,900 238,300 Diluted Average Shares 247.300 253,300 256,300 239,800 EBITDA 1.744,800 1,692,200 1,364,100 2,416.700 Step by Step Solution
There are 3 Steps involved in it
Step: 1

Get Instant Access to Expert-Tailored Solutions
See step-by-step solutions with expert insights and AI powered tools for academic success
Step: 2

Step: 3
Ace Your Homework with AI
Get the answers you need in no time with our AI-driven, step-by-step assistance
Get Started
A Compilation Of University Level Assignments Marketing Audit Approach
Authors: Emeka Anyaduba
1st Edition
1475098057, 978-1475098051