Perform Beneish M-Score ratios (See Appendix 2, Table 4). Input your formulas in the provided format Below and show formulas (Appendix 2, Tale 4).
Based on the M-Score results, indicate in which year(s) fraud might have occurred 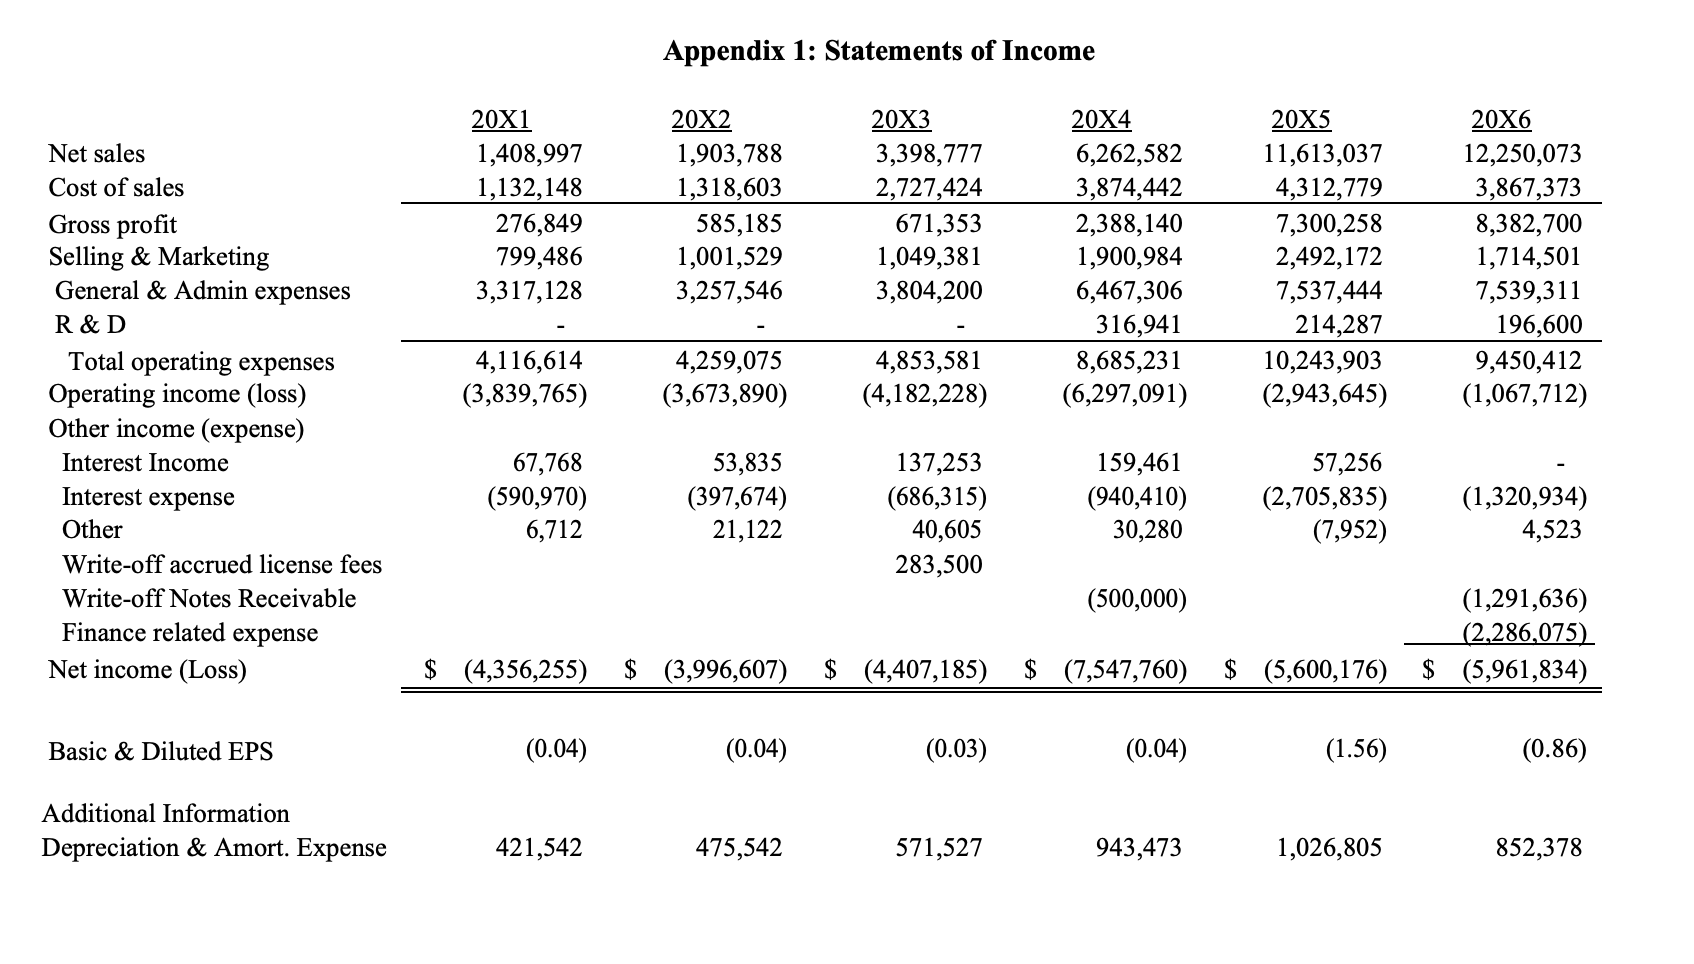
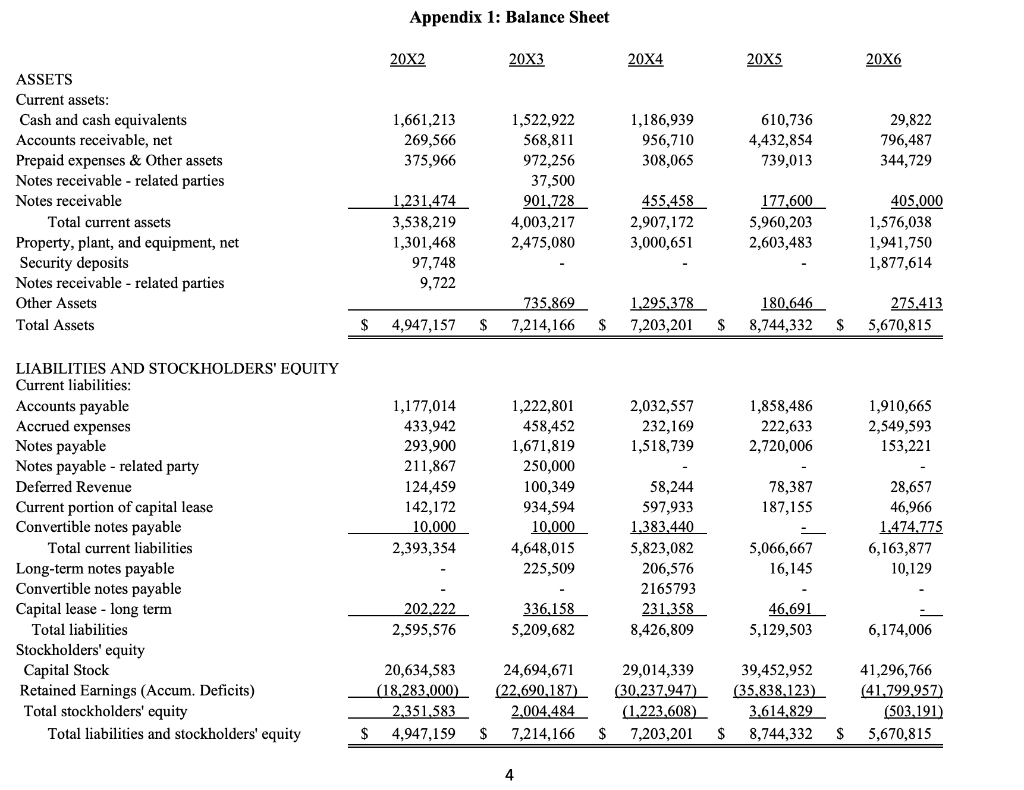
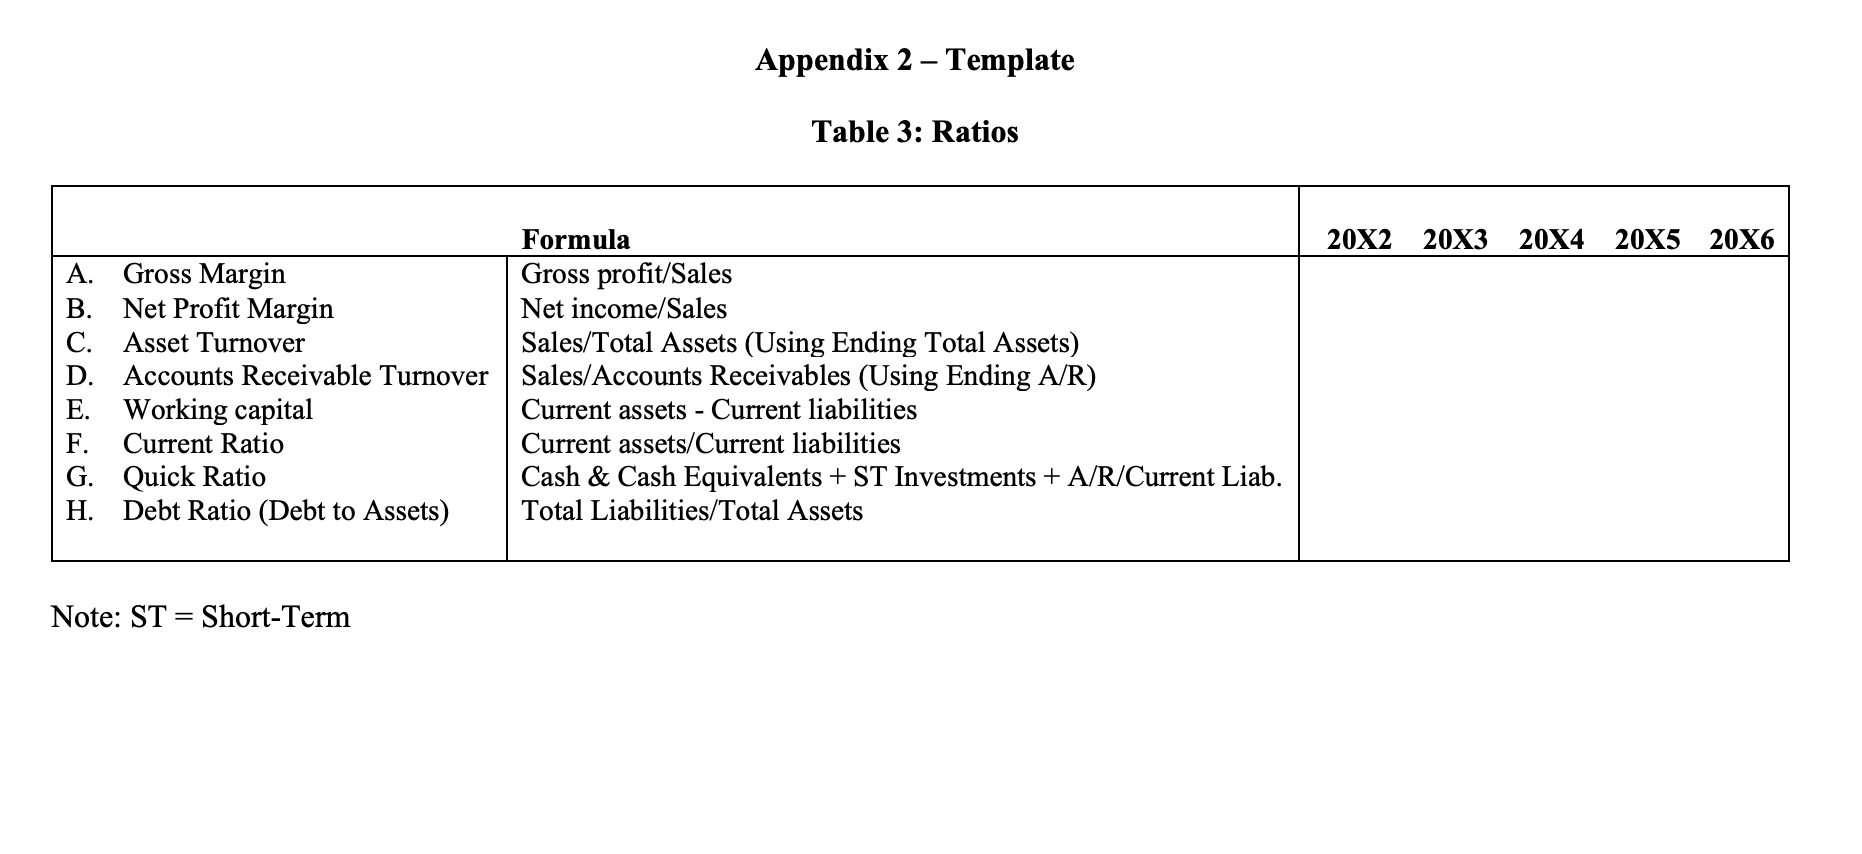
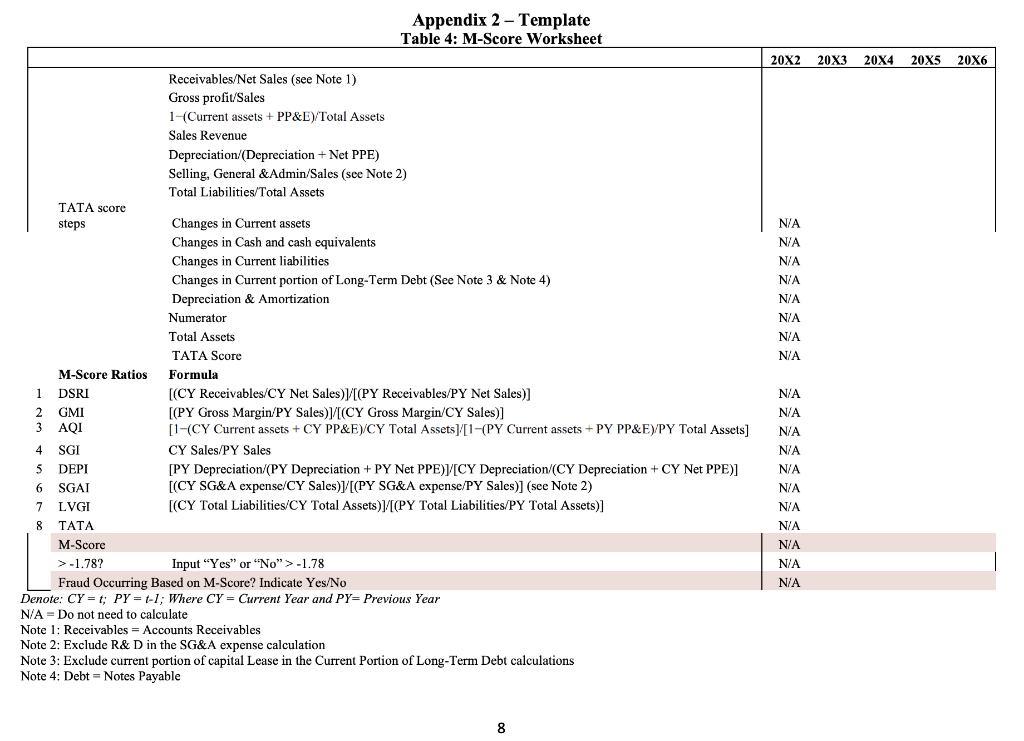
Appendix 1: Statements of Income 20X1 1,408,997 1,132,148 276,849 799,486 3,317,128 20X2 1,903,788 1,318,603 585,185 1,001,529 3,257,546 20X3 3,398,777 2,727,424 671,353 1,049,381 3,804,200 20X4 6,262,582 3,874,442 2,388,140 1,900,984 6,467,306 316,941 8,685,231 (6,297,091) 20X5 11,613,037 4,312,779 7,300,258 2,492,172 7,537,444 214,287 10,243,903 (2,943,645) 20X6 12,250,073 3,867,373 8,382,700 1,714,501 7,539,311 196,600 9,450,412 (1,067,712) 4,116,614 (3,839,765) 4,259,075 (3,673,890) 4,853,581 (4,182,228) Net sales Cost of sales Gross profit Selling & Marketing General & Admin expenses R&D Total operating expenses Operating income (loss) Other income (expense) Interest Income Interest expense Other Write-off accrued license fees Write-off Notes Receivable Finance related expense Net income (Loss) 67,768 (590,970) 6,712 53,835 (397,674) 21,122 137,253 (686,315) 40,605 283,500 159,461 (940,410) 30,280 57,256 (2,705,835) (7,952) (1,320,934) 4,523 (500,000) (1,291,636) |(2,286,075) $ (5,961,834) $ (4,356,255) $ (3,996,607) $ (4,407,185) $ (7,547,760) $ (5,600,176) Basic & Diluted EPS (0.04) (0.04) (0.03) (0.04) (1.56) (0.86) Additional Information Depreciation & Amort. Expense 421,542 475,542 571,527 943,473 1,026,805 852,378 Appendix 1: Balance Sheet 20X2 20X3 20X4 20X5 20X6 1,661,213 269,566 375,966 1,186,939 956,710 308,065 610,736 4,432,854 739,013 29,822 796,487 344,729 ASSETS Current assets: Cash and cash equivalents Accounts receivable, net Prepaid expenses & Other assets Notes receivable - related parties Notes receivable Total current assets Property, plant, and equipment, net Security deposits Notes receivable - related parties Other Assets Total Assets 1,522,922 568,811 972,256 37,500 901,728 4,003,217 2,475,080 1,231,474 3,538,219 1,301,468 97,748 9,722 455,458 2,907,172 3,000,651 177,600 5,960,203 2,603,483 405,000 1,576,038 1,941,750 1,877,614 735,869 7,214,166 1.295,378 7,203,201 180,646_ 8,744,332 275,413 5,670,815 $ 4,947,157 $ $ $ $ 2,032,557 232,169 1,518,739 1,858,486 222,633 2,720,006 1,910,665 2,549,593 153,221 LIABILITIES AND STOCKHOLDERS' EQUITY Current liabilities: Accounts payable Accrued expenses Notes payable Notes payable - related party Deferred Revenue Current portion of capital lease Convertible notes payable Total current liabilities Long-term notes payable Convertible notes payable Capital lease - long term Total liabilities Stockholders' equity Capital Stock Retained Earnings (Accum. Deficits) Total stockholders' equity Total liabilities and stockholders' equity 1,177,014 433,942 293,900 211,867 124,459 142,172 10,000 2,393,354 1,222,801 458,452 1,671,819 250,000 100,349 934,594 10,000 4,648,015 225,509 78,387 187,155 58,244 597,933 1,383,440 5,823,082 206,576 2165793 231,358 8,426,809 28,657 46,966 1,474,775 6,163,877 10,129 5,066,667 16,145 202.222 336,158 5,209,682 46,691 5,129,503 2,595,576 6,174,006 39,452,952 (35,838,123) 20,634,583 (18,283,000) 2,351,583 4,947,159 24,694,671 (22,690,187) 2,004,484 7,214,166 29,014,339 (30,237,947) (1,223,608) 7,203,201 41,296,766 (41,799,957) (503,191) 5,670,815 $ $ $ $ 2014.024 8,744,332 $ Appendix 2 - Template Table 1: Statements of Income Horizontal Analysis* 2083 2084 2085 Vertical Analysis 2083 2084 2085 2082 2086 2081 2082 2086 Net sales Cost of sales Gross profit Selling & Marketing General & Admin expenses R&D Total operating expenses Operating income (loss) Other income (expense) Interest Income Interest expense Other Write-off accrued license fees Write-off Notes Receivable Finance related expense Net income (Loss) Basic & Diluted EPS Additional Information Depreciation & Amort. Expense Note to Students: Perform horizontal (year-to-year changes) analysis. For example: For 20X4 Horizontal Analysis = [(20X4 data - 20X3 data)/20X3 data] 2086 Appendix 2 - Template Table 2: Balance Sheet Horizontal Analysis* Vertical Analysis 2082 2083 2084 2085 20X6 2082 2083 2084 2085 ASSETS Current assets: Cash and cash equivalents N/A Accounts receivable, net N/A Prepaid expenses & Other assets N/A Notes receivable - related parties N/A Notes receivable N/A Total current assets N/A Property, plant, and equipment, net N/A Security deposits N/A Notes receivable - related parties N/A Other Assets N/A Total Assets N/A LIABILITIES AND STOCKHOLDERS' EQUITY Current liabilities: Accounts payable N/A Accrued expenses N/A Notes payable N/A Notes payable - related party Deferred Revenue N/A Current portion of capital lease N/A Convertible notes payable N/A Total current liabilities N/A Long-term notes payable N/A Convertible notes payable N/A Capital lease - long term N/A Total liabilities N/A Stockholders' equity Capital Stock N/A Retained Earnings (Accum. Deficits) N/A Total stockholders' equity N/A Total liabilities and stockholders' equity N/A Hote to Students: Perform horizontal (year-to-year changes) analysis. For example: For 20X4 Horizontal Analysis -[(20X4 data - 20X3 data)/20X3 data] N/A Appendix 2 Template Table 3: Ratios 2082 2083 2084 2085 2086 A. Gross Margin B. Net Profit Margin C. Asset Turnover D. Accounts Receivable Turnover E. Working capital F. Current Ratio G. Quick Ratio H. Debt Ratio (Debt to Assets) Formula Gross profit/Sales Net income/Sales Sales/Total Assets (Using Ending Total Assets) Sales/Accounts Receivables (Using Ending A/R) Current assets - Current liabilities Current assets/Current liabilities Cash & Cash Equivalents + ST Investments + A/R/Current Liab. Total Liabilities/Total Assets Note: ST = Short-Term Appendix 2 - Template Table 4: M-Score Worksheet 20X220X320X4 2085 20X6 NA N/A NA NA N/A N/A N/A Receivables/Net Sales (see Note 1) Gross profit/Sales 1-(Current assets + PP&E)/Total Assets Sales Revenue Depreciation (Depreciation + Net PPE) Selling, General & Admin/Sales (see Note 2) Total Liabilities/Total Assets TATA score steps Changes in Current assets Changes in Cash and cash equivalents Changes in Current liabilities Changes in Current portion of Long-Term Debt (See Note 3 & Note 4) Depreciation & Amortization Numerator Total Assets TATA Score M-Score Ratios Formula 1 DSRI [(CY Receivables/CY Net Sales)/[(PY Receivables/PY Net Sales)] 2 GMI [(PY Gross Margin/PY Sales)/[(CY Gross Margin/CY Sales)] 3 AQI [1-(CY Current assets + CY PP&E)/CY Total Assets]/[1-(PY Current assets + PY PP&EYPY Total Assets) SGI CY Sales/PY Sales 5 DEPI [PY Depreciation/(PY Depreciation + PY Net PPE) [CY Depreciation/(CY Depreciation + CY Net PPE)] 6 SGAI [(CY SG&A expense/CY Sales)]/[(PY SG&A expense/PY Sales)] (see Note 2) 7 LVGI [(CY Total Liabilities/CY Total Assets)/(PY Total Liabilities/PY Total Assets)] 8 TATA M-Score > -1.78? Input "Yes" or "No">-1.78 Fraud Occurring Based on M-Score? Indicate Yes/No Denote: CY = t; PY = t-1; Where CY = Current Year and PY= Previous Year N/A=Do not need to calculate Note 1: Receivables = Accounts Receivables Note 2: Exclude R&D in the SG&A expense calculation Note 3: Exclude current portion of capital Lease in the Current Portion of Long-Term Debt calculations Note 4: Debt = Notes Payable N/A NA N/A NA N/A NA N/A N/A N/A N/A N/A Appendix 1: Statements of Income 20X1 1,408,997 1,132,148 276,849 799,486 3,317,128 20X2 1,903,788 1,318,603 585,185 1,001,529 3,257,546 20X3 3,398,777 2,727,424 671,353 1,049,381 3,804,200 20X4 6,262,582 3,874,442 2,388,140 1,900,984 6,467,306 316,941 8,685,231 (6,297,091) 20X5 11,613,037 4,312,779 7,300,258 2,492,172 7,537,444 214,287 10,243,903 (2,943,645) 20X6 12,250,073 3,867,373 8,382,700 1,714,501 7,539,311 196,600 9,450,412 (1,067,712) 4,116,614 (3,839,765) 4,259,075 (3,673,890) 4,853,581 (4,182,228) Net sales Cost of sales Gross profit Selling & Marketing General & Admin expenses R&D Total operating expenses Operating income (loss) Other income (expense) Interest Income Interest expense Other Write-off accrued license fees Write-off Notes Receivable Finance related expense Net income (Loss) 67,768 (590,970) 6,712 53,835 (397,674) 21,122 137,253 (686,315) 40,605 283,500 159,461 (940,410) 30,280 57,256 (2,705,835) (7,952) (1,320,934) 4,523 (500,000) (1,291,636) |(2,286,075) $ (5,961,834) $ (4,356,255) $ (3,996,607) $ (4,407,185) $ (7,547,760) $ (5,600,176) Basic & Diluted EPS (0.04) (0.04) (0.03) (0.04) (1.56) (0.86) Additional Information Depreciation & Amort. Expense 421,542 475,542 571,527 943,473 1,026,805 852,378 Appendix 1: Balance Sheet 20X2 20X3 20X4 20X5 20X6 1,661,213 269,566 375,966 1,186,939 956,710 308,065 610,736 4,432,854 739,013 29,822 796,487 344,729 ASSETS Current assets: Cash and cash equivalents Accounts receivable, net Prepaid expenses & Other assets Notes receivable - related parties Notes receivable Total current assets Property, plant, and equipment, net Security deposits Notes receivable - related parties Other Assets Total Assets 1,522,922 568,811 972,256 37,500 901,728 4,003,217 2,475,080 1,231,474 3,538,219 1,301,468 97,748 9,722 455,458 2,907,172 3,000,651 177,600 5,960,203 2,603,483 405,000 1,576,038 1,941,750 1,877,614 735,869 7,214,166 1.295,378 7,203,201 180,646_ 8,744,332 275,413 5,670,815 $ 4,947,157 $ $ $ $ 2,032,557 232,169 1,518,739 1,858,486 222,633 2,720,006 1,910,665 2,549,593 153,221 LIABILITIES AND STOCKHOLDERS' EQUITY Current liabilities: Accounts payable Accrued expenses Notes payable Notes payable - related party Deferred Revenue Current portion of capital lease Convertible notes payable Total current liabilities Long-term notes payable Convertible notes payable Capital lease - long term Total liabilities Stockholders' equity Capital Stock Retained Earnings (Accum. Deficits) Total stockholders' equity Total liabilities and stockholders' equity 1,177,014 433,942 293,900 211,867 124,459 142,172 10,000 2,393,354 1,222,801 458,452 1,671,819 250,000 100,349 934,594 10,000 4,648,015 225,509 78,387 187,155 58,244 597,933 1,383,440 5,823,082 206,576 2165793 231,358 8,426,809 28,657 46,966 1,474,775 6,163,877 10,129 5,066,667 16,145 202.222 336,158 5,209,682 46,691 5,129,503 2,595,576 6,174,006 39,452,952 (35,838,123) 20,634,583 (18,283,000) 2,351,583 4,947,159 24,694,671 (22,690,187) 2,004,484 7,214,166 29,014,339 (30,237,947) (1,223,608) 7,203,201 41,296,766 (41,799,957) (503,191) 5,670,815 $ $ $ $ 2014.024 8,744,332 $ Appendix 2 - Template Table 1: Statements of Income Horizontal Analysis* 2083 2084 2085 Vertical Analysis 2083 2084 2085 2082 2086 2081 2082 2086 Net sales Cost of sales Gross profit Selling & Marketing General & Admin expenses R&D Total operating expenses Operating income (loss) Other income (expense) Interest Income Interest expense Other Write-off accrued license fees Write-off Notes Receivable Finance related expense Net income (Loss) Basic & Diluted EPS Additional Information Depreciation & Amort. Expense Note to Students: Perform horizontal (year-to-year changes) analysis. For example: For 20X4 Horizontal Analysis = [(20X4 data - 20X3 data)/20X3 data] 2086 Appendix 2 - Template Table 2: Balance Sheet Horizontal Analysis* Vertical Analysis 2082 2083 2084 2085 20X6 2082 2083 2084 2085 ASSETS Current assets: Cash and cash equivalents N/A Accounts receivable, net N/A Prepaid expenses & Other assets N/A Notes receivable - related parties N/A Notes receivable N/A Total current assets N/A Property, plant, and equipment, net N/A Security deposits N/A Notes receivable - related parties N/A Other Assets N/A Total Assets N/A LIABILITIES AND STOCKHOLDERS' EQUITY Current liabilities: Accounts payable N/A Accrued expenses N/A Notes payable N/A Notes payable - related party Deferred Revenue N/A Current portion of capital lease N/A Convertible notes payable N/A Total current liabilities N/A Long-term notes payable N/A Convertible notes payable N/A Capital lease - long term N/A Total liabilities N/A Stockholders' equity Capital Stock N/A Retained Earnings (Accum. Deficits) N/A Total stockholders' equity N/A Total liabilities and stockholders' equity N/A Hote to Students: Perform horizontal (year-to-year changes) analysis. For example: For 20X4 Horizontal Analysis -[(20X4 data - 20X3 data)/20X3 data] N/A Appendix 2 Template Table 3: Ratios 2082 2083 2084 2085 2086 A. Gross Margin B. Net Profit Margin C. Asset Turnover D. Accounts Receivable Turnover E. Working capital F. Current Ratio G. Quick Ratio H. Debt Ratio (Debt to Assets) Formula Gross profit/Sales Net income/Sales Sales/Total Assets (Using Ending Total Assets) Sales/Accounts Receivables (Using Ending A/R) Current assets - Current liabilities Current assets/Current liabilities Cash & Cash Equivalents + ST Investments + A/R/Current Liab. Total Liabilities/Total Assets Note: ST = Short-Term Appendix 2 - Template Table 4: M-Score Worksheet 20X220X320X4 2085 20X6 NA N/A NA NA N/A N/A N/A Receivables/Net Sales (see Note 1) Gross profit/Sales 1-(Current assets + PP&E)/Total Assets Sales Revenue Depreciation (Depreciation + Net PPE) Selling, General & Admin/Sales (see Note 2) Total Liabilities/Total Assets TATA score steps Changes in Current assets Changes in Cash and cash equivalents Changes in Current liabilities Changes in Current portion of Long-Term Debt (See Note 3 & Note 4) Depreciation & Amortization Numerator Total Assets TATA Score M-Score Ratios Formula 1 DSRI [(CY Receivables/CY Net Sales)/[(PY Receivables/PY Net Sales)] 2 GMI [(PY Gross Margin/PY Sales)/[(CY Gross Margin/CY Sales)] 3 AQI [1-(CY Current assets + CY PP&E)/CY Total Assets]/[1-(PY Current assets + PY PP&EYPY Total Assets) SGI CY Sales/PY Sales 5 DEPI [PY Depreciation/(PY Depreciation + PY Net PPE) [CY Depreciation/(CY Depreciation + CY Net PPE)] 6 SGAI [(CY SG&A expense/CY Sales)]/[(PY SG&A expense/PY Sales)] (see Note 2) 7 LVGI [(CY Total Liabilities/CY Total Assets)/(PY Total Liabilities/PY Total Assets)] 8 TATA M-Score > -1.78? Input "Yes" or "No">-1.78 Fraud Occurring Based on M-Score? Indicate Yes/No Denote: CY = t; PY = t-1; Where CY = Current Year and PY= Previous Year N/A=Do not need to calculate Note 1: Receivables = Accounts Receivables Note 2: Exclude R&D in the SG&A expense calculation Note 3: Exclude current portion of capital Lease in the Current Portion of Long-Term Debt calculations Note 4: Debt = Notes Payable N/A NA N/A NA N/A NA N/A N/A N/A N/A N/A


