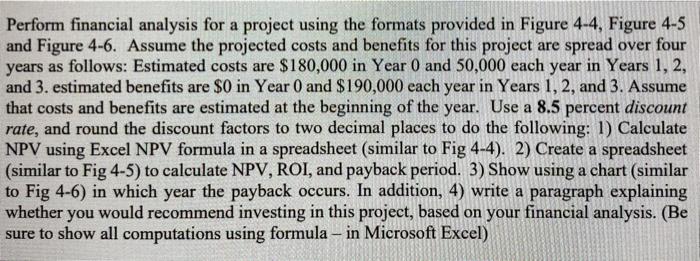
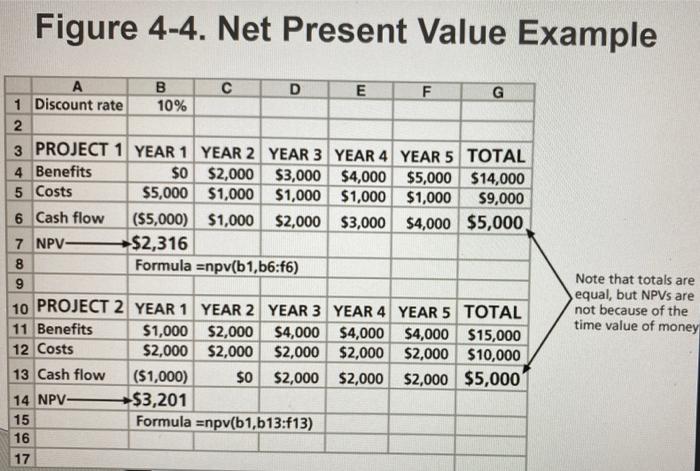
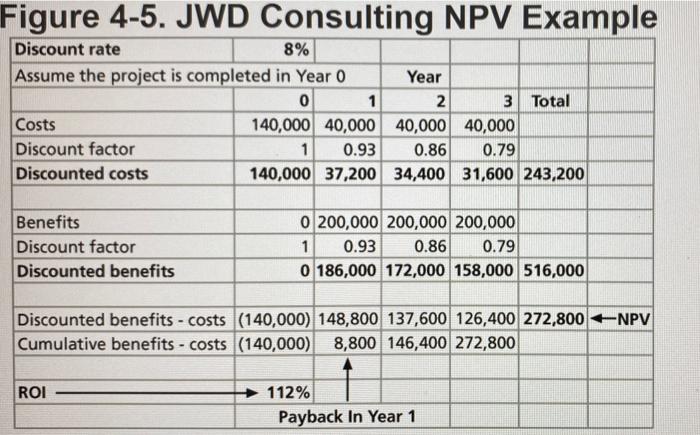
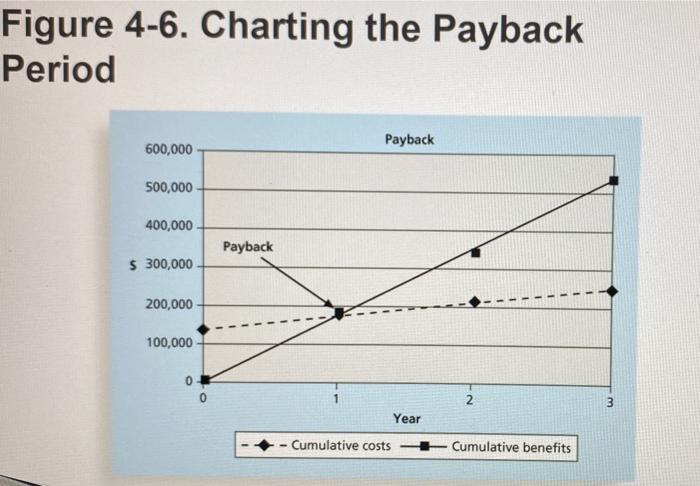
Perform financial analysis for a project using the formats provided in Figure 4-4, Figure 4-5 and Figure 4-6. Assume the projected costs and benefits for this project are spread over four years as follows: Estimated costs are $180,000 in Year 0 and 50,000 each year in Years 1, 2, and 3. estimated benefits are $0 in Year 0 and $190,000 each year in Years 1, 2, and 3. Assume that costs and benefits are estimated at the beginning of the year. Use a 8.5 percent discount rate, and round the discount factors to two decimal places to do the following: 1) Calculate NPV using Excel NPV formula in a spreadsheet (similar to Fig 4-4). 2) Create a spreadsheet (similar to Fig 4-5) to calculate NPV, ROI, and payback period. 3) Show using a chart (similar to Fig 4-6) in which year the payback occurs. In addition, 4) write a paragraph explaining whether you would recommend investing in this project, based on your financial analysis. (Be sure to show all computations using formula - in Microsoft Excel) Figure 4-4. Net Present Value Example B D E F G 1 Discount rate 10% 2 3 PROJECT 1 YEAR 1 YEAR 2 YEAR 3 YEAR 4 YEAR 5 TOTAL 4 Benefits $0 $2,000 $3,000 $4,000 $5,000 $14,000 5 Costs $5,000 $1,000 $1,000 $1,000 $1,000 $9,000 6 Cash flow ($5,000) $1,000 $2,000 $3,000 $4,000 $5,000 7 NPV- -$2,316 8 Formula =npv(b1,b6:16) 9 10 PROJECT 2 YEAR 1 YEAR 2 YEAR 3 YEAR 4 YEAR 5 TOTAL 11 Benefits $1,000 $2,000 $4,000 $4,000 $4,000 $15,000 12 Costs $2,000 $2,000 $2,000 $2,000 $2,000 $10,000 13 Cash flow ($1,000) $0 $2,000 $2,000 $2,000 $5,000 14 NPV- $3,201 15 Formula Enpv(b1,b13:f13) 16 17 Note that totals are equal, but NPVs are not because of the time value of money Figure 4-5. JWD Consulting NPV Example Discount rate 8% Assume the project is completed in Year 0 Year 0 1 2 3 Total Costs 140,000 40,000 40,000 40,000 Discount factor 1 0.93 0.86 0.79 Discounted costs 140,000 37,200 34,400 31,600 243,200 Benefits Discount factor Discounted benefits 0 200,000 200,000 200,000 1 0.93 0.86 0.79 0 186,000 172,000 158,000 516,000 Discounted benefits - costs (140,000) 148,800 137,600 126,400 272,800 NPV Cumulative benefits - costs (140,000) 8,800 146,400 272,800 ROI 112% Payback In Year 1 Figure 4-6. Charting the Payback Period Payback 600,000 500,000 400,000 Payback $ 300,000 200,000 100,000 0 2 3 Year Cumulative costs Cumulative benefits