Answered step by step
Verified Expert Solution
Question
1 Approved Answer
perform horizontal analysis for the information provided for the past 3 years for both the income statement and the balance sheet provided. (In Thousands) (USD)
perform horizontal analysis for the information provided for the past 3 years for both the income statement and the balance sheet provided.
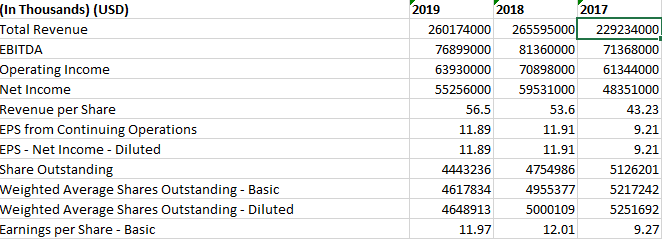
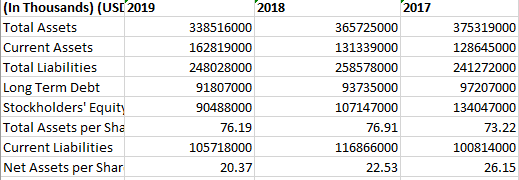
(In Thousands) (USD) Total Revenue EBITDA Operating Income Net Income Revenue per Share EPS from Continuing Operations EPS - Net Income - Diluted Share Outstanding Weighted Average Shares Outstanding - Basic Weighted Average Shares Outstanding - Diluted Earnings per Share - Basic 2019 2018 2017 260174000 265595000 229234000 76899000 81360000 71368000 63930000 70898000 61344000 55256000 59531000 48351000 56.5 53.6 43.23 11.89 11.91 9.21 11.89 11.91 9.21 4443236 4754986 5126201 4617834 4955377 5217242 4648913 5000109 5251692 11.97 12.01 9.27 2017 375319000 128645000 (In Thousands) (US[ 2019 Total Assets Current Assets Total Liabilities Long Term Debt Stockholders' Equity Total Assets per Sha Current Liabilities Net Assets per Shar 2018 338516000 162819000 248028000 91807000 90488000 76.19 105718000 20.37 365725000 131339000 258578000 93735000 107147000 76.91 116866000 22.53 241272000 97207000 134047000 73.22 100814000 26.15Step by Step Solution
There are 3 Steps involved in it
Step: 1
Get Instant Access to Expert-Tailored Solutions
See step-by-step solutions with expert insights and AI powered tools for academic success
Step: 2
Step: 3
Ace Your Homework with AI
Get the answers you need in no time with our AI-driven, step-by-step assistance
Get Started