

Answered step by step
Verified Expert Solution
Question
1 Approved Answer
perform horizontal and vertical analysis for this company (Affin Bank) i believe its slightly clearer, you could zoom in aswell The Group 2018 2017 RM
perform horizontal and vertical analysis for this company (Affin Bank) 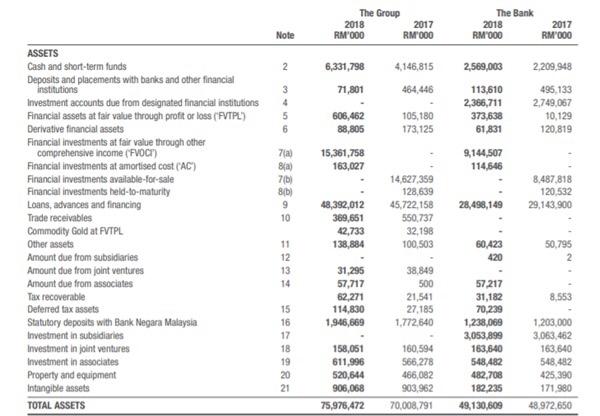
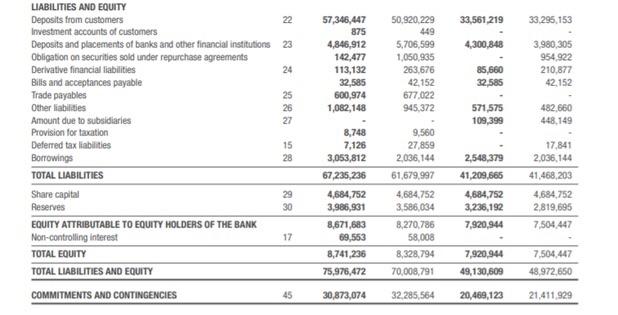


i believe its slightly clearer, you could zoom in aswell
The Group 2018 2017 RM 000 RM 000 The Bank 2018 RM 000 Note 2017 RM 000 2 2,569,003 2,209,948 6,331,798 71,801 4,146,815 464,446 4 5 6 113,610 2,366,711 373,638 61,831 495 133 2,749,067 10,129 120,819 105,180 173,125 606,462 88,805 15,361,758 163,027 7(a) Bja) 7b 9.144,507 114,646 SD) 8,487.818 120,532 29,143,900 28,498,149 9 10 ASSETS Cash and short-term funds Deposits and placements with banks and other financial institutions Investment accounts due from designated financial institutions Financial assets at fair value through profit or loss ('VTPL) Derivative financial assets Financial investments at fair value through other comprehensive income (FVOCH) Financial investments at amortised cost (AC) Financial investments available-for-sale Financial investments held-to-maturity Loans, advances and financing Trade receivables Commodity Gold at FVTPL Other assets Amount due from subsidiaries Amount due from joint ventures Amount due from associates Tax recoverable Deferred tax assets Statutory deposits with Bank Negara Malaysia Investment in subsidiaries Investment in joint ventures Investment in associates Property and equipment Intangible assets TOTAL ASSETS 48,392,012 389,651 42,733 138,884 14,627,359 128,639 45.722,158 550,737 32,198 100.503 60,423 420 50,795 2 11 12 13 14 31.295 57,717 62,271 114,830 1,946,669 38.849 500 21,541 27.185 1.772,640 8.553 15 16 17 18 19 20 21 158,051 611,996 520,644 906,068 75,976,472 160,594 566,278 466,082 903.962 70,008,791 57,217 31,182 70,239 1,238,069 3,053,899 163,640 548,482 482,708 182.235 49,130,609 1.203.000 3,063,462 163,640 548,482 425,390 171.980 48,972,650 33,561,219 33.295,153 4,300,848 57,346,447 875 4,846,912 142,477 113,132 32,585 600,974 1,082,148 50,320.229 449 5,706,599 1,050,935 263.676 42.152 677,022 945,372 3,980,305 954 922 210,877 42,152 85,560 32,585 571,575 109,399 482 660 448,149 LIABILITIES AND EQUITY Deposits from customers 22 Investment accounts of customers Deposits and placements of banks and other financial institutions 23 Obligation on securities sold under repurchase agreements Derivative financial liabilities 24 Bills and acceptances payable Trade payables 25 Other liabilities 26 Amount due to subsidiaries 27 Provision for tacation Deferred tax liabilities 15 Borrowings 28 TOTAL LIABILITIES Share capital 29 Reserves 30 EQUITY ATTRIBUTABLE TO EQUITY HOLDERS OF THE BANK Nor-controlling interest 17 TOTAL EQUITY TOTAL LIABILITIES AND EQUITY 17,841 2.036,144 41,468,203 8,748 7,126 3,053,812 67,235, 236 4,684,752 3,986,931 8,671,683 69,553 8,741,236 75,976,472 9,560 27,859 2,036,144 61,679,997 4,684.752 3,586,034 8,270,786 58,008 8,328,794 70,008,791 2,548,379 41,209,665 4,684,752 3,236,192 7,920,944 4,684,752 2.819,695 7,504,447 7,920,944 49,130,609 7,504,447 48.972,650 COMMITMENTS AND CONTINGENCIES 45 30,873,074 32,285,564 20,469,123 21.411,929 The Group 2018 2017 RM 000 RM 000 The Bank 2018 RM 000 Note 2017 RM 000 2 2,569,003 2,209,948 6,331,798 71,801 4,146,815 464,446 4 5 6 113,610 2,366,711 373,638 61,831 495 133 2,749,067 10,129 120,819 105,180 173,125 606,462 88,805 15,361,758 163,027 7(a) Bja) 7b 9.144,507 114,646 SD) 8,487.818 120,532 29,143,900 28,498,149 9 10 ASSETS Cash and short-term funds Deposits and placements with banks and other financial institutions Investment accounts due from designated financial institutions Financial assets at fair value through profit or loss ('VTPL) Derivative financial assets Financial investments at fair value through other comprehensive income (FVOCH) Financial investments at amortised cost (AC) Financial investments available-for-sale Financial investments held-to-maturity Loans, advances and financing Trade receivables Commodity Gold at FVTPL Other assets Amount due from subsidiaries Amount due from joint ventures Amount due from associates Tax recoverable Deferred tax assets Statutory deposits with Bank Negara Malaysia Investment in subsidiaries Investment in joint ventures Investment in associates Property and equipment Intangible assets TOTAL ASSETS 48,392,012 389,651 42,733 138,884 14,627,359 128,639 45.722,158 550,737 32,198 100.503 60,423 420 50,795 2 11 12 13 14 31.295 57,717 62,271 114,830 1,946,669 38.849 500 21,541 27.185 1.772,640 8.553 15 16 17 18 19 20 21 158,051 611,996 520,644 906,068 75,976,472 160,594 566,278 466,082 903.962 70,008,791 57,217 31,182 70,239 1,238,069 3,053,899 163,640 548,482 482,708 182.235 49,130,609 1.203.000 3,063,462 163,640 548,482 425,390 171.980 48,972,650 33,561,219 33.295,153 4,300,848 57,346,447 875 4,846,912 142,477 113,132 32,585 600,974 1,082,148 50,320.229 449 5,706,599 1,050,935 263.676 42.152 677,022 945,372 3,980,305 954 922 210,877 42,152 85,560 32,585 571,575 109,399 482 660 448,149 LIABILITIES AND EQUITY Deposits from customers 22 Investment accounts of customers Deposits and placements of banks and other financial institutions 23 Obligation on securities sold under repurchase agreements Derivative financial liabilities 24 Bills and acceptances payable Trade payables 25 Other liabilities 26 Amount due to subsidiaries 27 Provision for tacation Deferred tax liabilities 15 Borrowings 28 TOTAL LIABILITIES Share capital 29 Reserves 30 EQUITY ATTRIBUTABLE TO EQUITY HOLDERS OF THE BANK Nor-controlling interest 17 TOTAL EQUITY TOTAL LIABILITIES AND EQUITY 17,841 2.036,144 41,468,203 8,748 7,126 3,053,812 67,235, 236 4,684,752 3,986,931 8,671,683 69,553 8,741,236 75,976,472 9,560 27,859 2,036,144 61,679,997 4,684.752 3,586,034 8,270,786 58,008 8,328,794 70,008,791 2,548,379 41,209,665 4,684,752 3,236,192 7,920,944 4,684,752 2.819,695 7,504,447 7,920,944 49,130,609 7,504,447 48.972,650 COMMITMENTS AND CONTINGENCIES 45 30,873,074 32,285,564 20,469,123 21.411,929 Step by Step Solution
There are 3 Steps involved in it
Step: 1

Get Instant Access to Expert-Tailored Solutions
See step-by-step solutions with expert insights and AI powered tools for academic success
Step: 2

Step: 3
Ace Your Homework with AI
Get the answers you need in no time with our AI-driven, step-by-step assistance
Get Started
Cost management a strategic approach
Authors: Edward J. Blocher, David E. Stout, Gary Cokins
5th edition
73526940, 978-0073526942