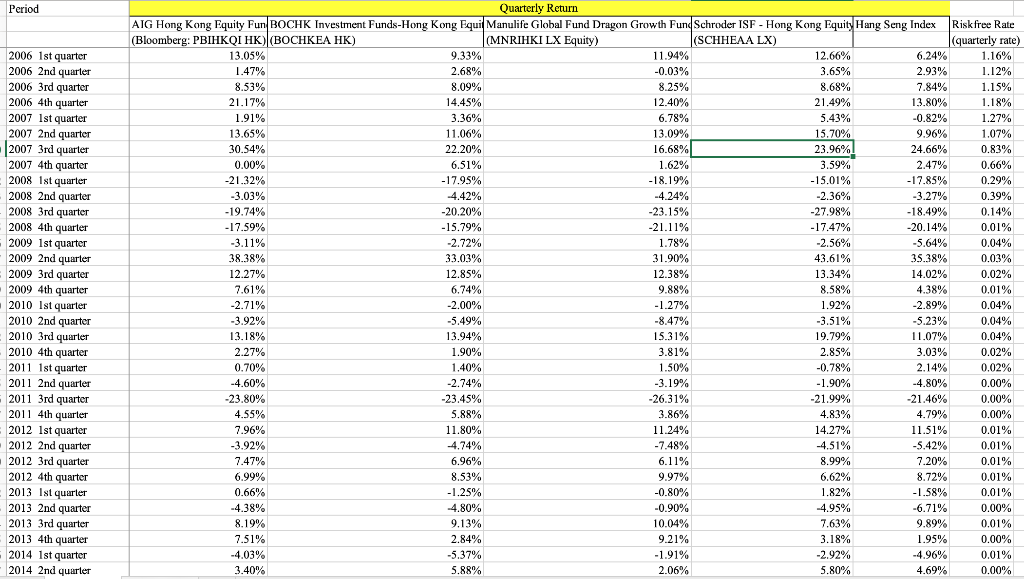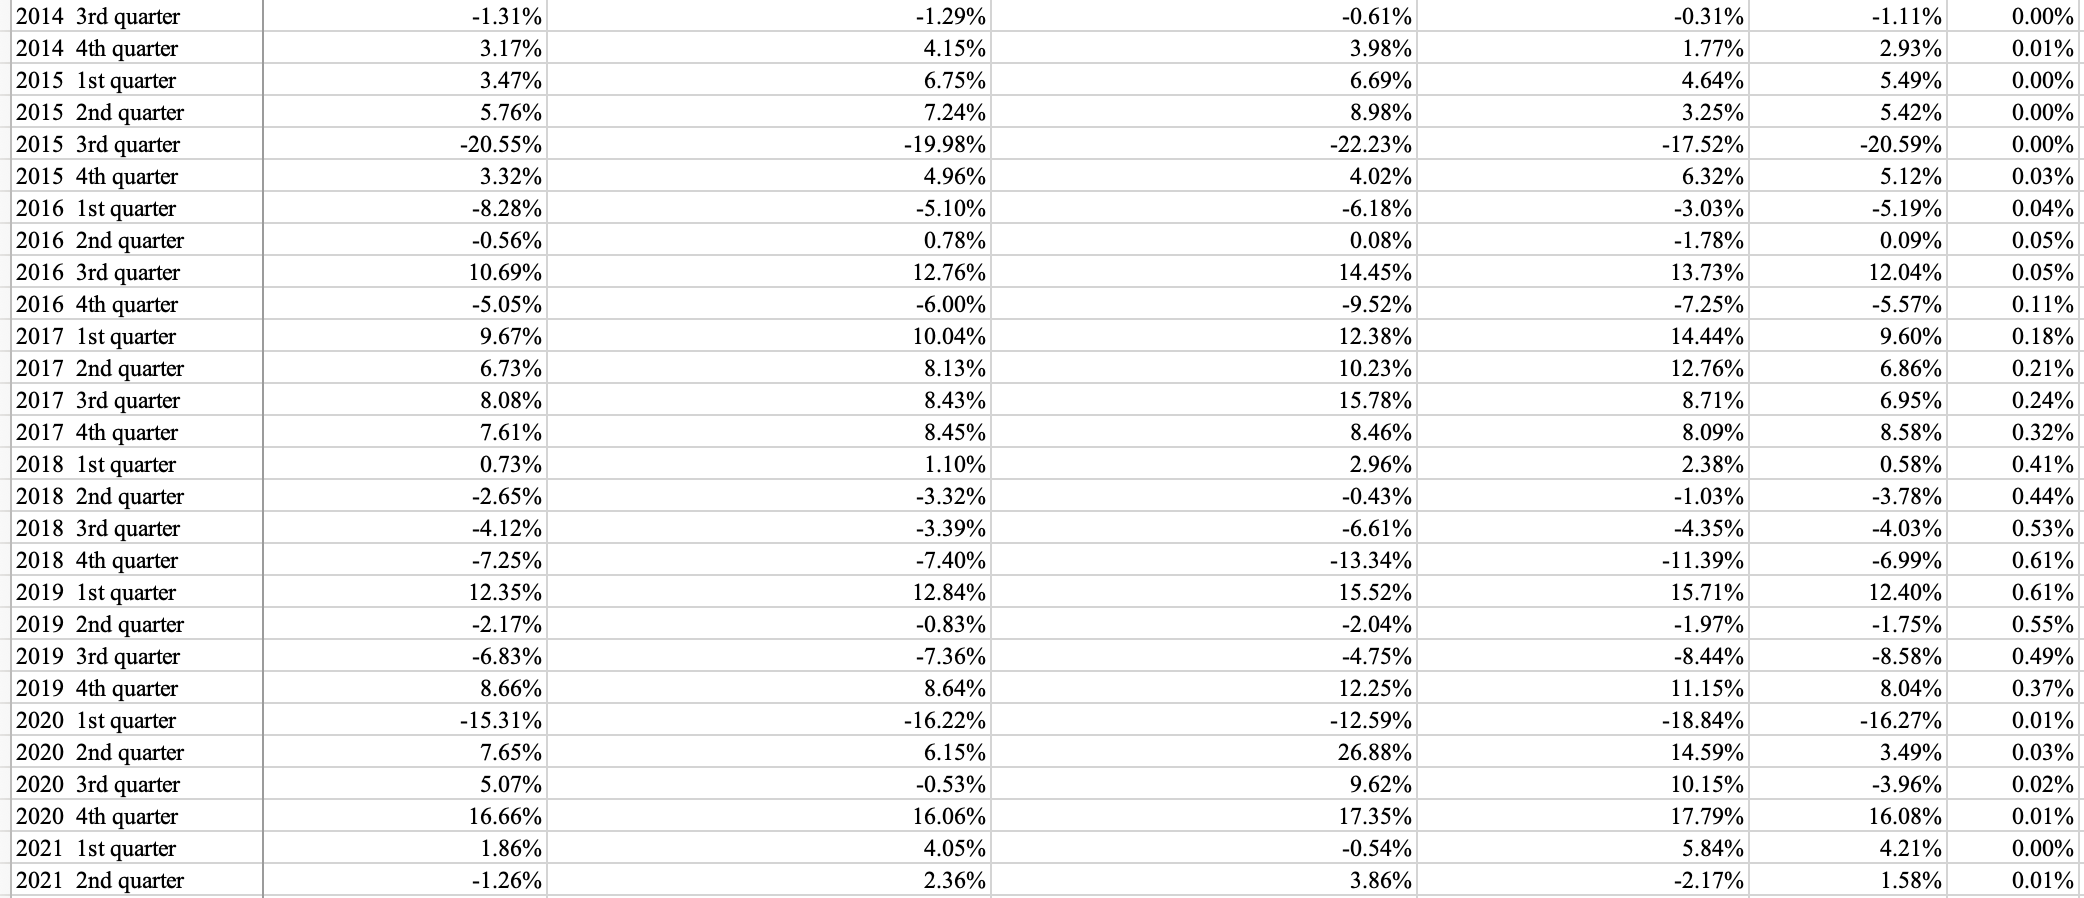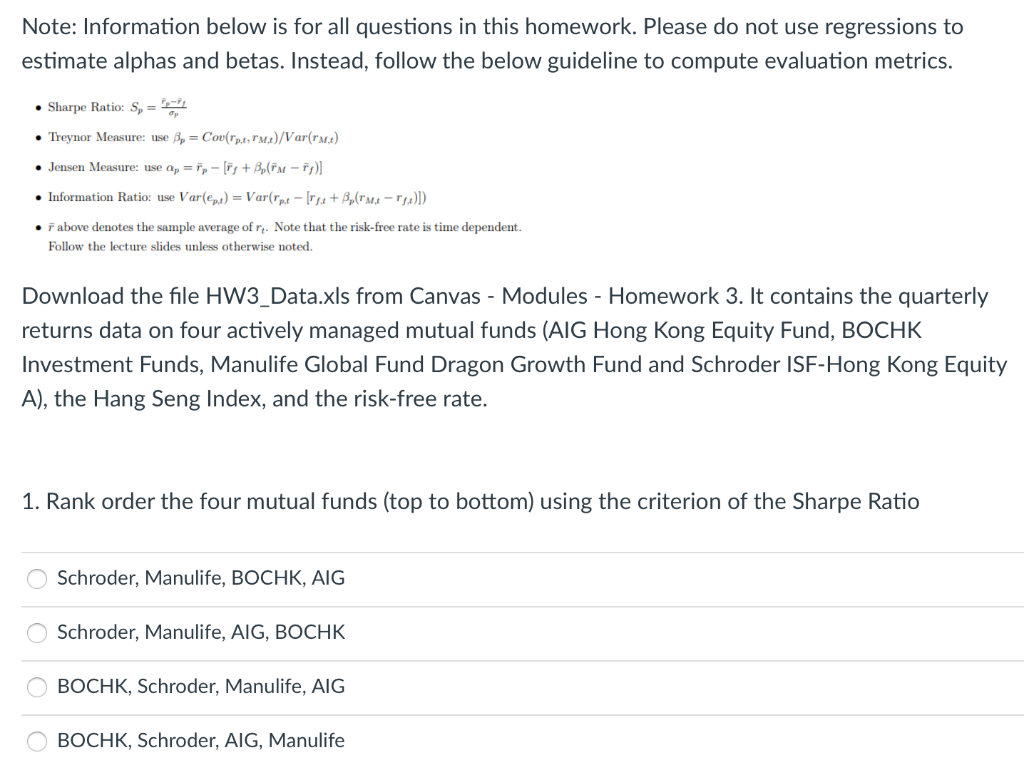


Period -0.03% 1.12% 8.09% 2006 4th quarter 35 280 14.020 Quarterly Return AIG Hong Kong Equity Fun BOCHK Investment Funds-Hong Kong Equi Manulife Global Fund Dragon Growth Fund Schroder ISF - Hong Kong Equity Hang Seng Index Riskfree Rate (Bloomberg: PBIHKQI HK)|(BOCHKEA HK) (MNRIHKI LX Equity) (sCHHEAA LX) (quarterly rate) 13.05% 9.33% 11.94% 12.66% 6.24% 1.16% 1.4770 1.47% 2.68% 3.65% 2.93% % 8.53% 0.03 0.25% 8.25% 8.68% 7.84% 1.15% 21.17% 1370 21.17 14.45% 100 12.40% 21.49% 13.80% 1.18% 1.91% 3.36% w.ro 11 1917 09 6.78% 5.43% -0.82% 1.27% 13.65% . 11.06% de 12.03 13.09% 15.70% 9.96% 1.07% 30.54% 22.20% co 16.68% 23.96% 24.66% 0.83% 0.00% 6.51% 200 woro Windo 1.62% 3.59% 2.47% 0.66% -21.329 -17.95% -18.19% 1 . -15.01% -17.85% 0.29% -3.03% 4.42% -4.24% -2.36% -3.27% 0.39% -19.74% -20.20% -23.15% -27.98% -18.49% 0.14% -17.59% - 15.79% -21.11% -17.47% -20.14% 0.01% -3.11% -2.72% 1.78% can -2.56% 2000 -5.64% 0.04% 38.38% 33.03% 31.90% 43.61% 12.610 090 1970 0.03% 12.27% 120 12.85% 12.38% 23902 13.34% 090 0.02% 7.61% 6.74% 9.88% 8.58% % 4.38% 0.01% -2.71% -2.00% -1.27% 1.92% -2.89% -3.92% -5.49% -3.51% -5.23% 0.04% % 13.18% 13.94% 1.5.94% 15.31% 19.79% % 11.07% 0.04% % 2.2170 2.27% 1.90% % 3.81% 3.0170 2.85% 3.03% 0.02% 0.70% 1.40% 1.50% -0.78% W.7070 2.14% 0.02% 2.17 W.VEZ Tauro -4.60% -2.74% -3.19% -1.90% 3.1770 0.00% -4.80% 1.9070 -23.80% Duro -23.45% 22.1370 -26.31% 20.010 -21.99% -21.46% 0.00% 4.55% 5.88% 41.00 VO 3.86% 4.8.3% 4.79% 0.00% 7.96% T. 11.80% 11.24% 14.27% 11.51% 0.01% -3.92% 4.74% -7.48% -4.51% -5.42% 0.01% 7.47% 6.96% 6.11% 8.99% 7.20% 0.01% 6.99% 8.53% 9.97% 6.62% 8.72% 0.01% 0.66% -1.25% -0.80% 1.82% -1.58% 0.01% -4.38% 4.80% 4.80% -0.90% -4.95% 0.00% % 8.19% 9.13% 10.04% % 7.63% 9.89% 0.01% 7.51% 2.84% 9.21% 3.18% 1.95% 0.00% -4.03% -5.37% -1.91% -2.92% -4.96% 0.01% 3.40% 5.88% 2.06% 5.80% 4.69% 0.00% 2006 1st quarter 2006 2nd quarter 2006 3rd quarter . 2007 Ist quarter quantes 2007 2nd quarter an 2007 3rd quarter 1400 2007 4th quarter 2008 1st quarter 2nd 2008 2nd quarter 2008 3rd quarter w 2008 4th quarter 000 2009 1st quarter 2000 2009 2nd quarter 2000 2009 3rd quarter 2000 2009 4th quarter 2010 Ist quarter 2010 2nd quarter 2010 3rd quarter 2010 4th quarter 2011 1st quarter 2011 2nd quarter 2011 3rd quarter 2011 4th quarter 2012 Ist quarter 2012 2nd quarter 2012 3rd quarter 2012 4th quarter 2013 Ist quarter 2013 2nd quarter 2013 3rd quarter 2013 4th quarter 2014 1st quarter 2014 2nd quarter . 0.04% 8.47% -6.71% 2014 3rd quarter 2014 4th quarter 2015 1st quarter 2015 2nd quarter 2015 3rd quarter 2015 4th quarter 2016 1st quarter 2016 2nd quarter 2016 3rd quarter 2016 4th quarter 2017 1st quarter 2017 2nd quarter 2017 3rd quarter 2017 4th quarter 2018 1st quarter 2018 2nd quarter 2018 3rd quarter 2018 4th quarter 2019 1st quarter 2019 2nd quarter 2019 3rd quarter 2019 4th quarter 2020 1st quarter 2020 2nd quarter 2020 3rd quarter 2020 4th quarter 2021 1st quarter 2021 2nd quarter -1.31% 3.17% 3.47% 5.76% -20.55% 3.32% -8.28% -0.56% 10.69% -5.05% 9.67% 6.73% 8.08% 7.61% 0.73% -2.65% -4.12% -7.25% 12.35% -2.17% -6.83% 8.66% -15.31% 7.65% 5.07% 16.66% 1.86% -1.26% -1.29% 4.15% 6.75% 7.24% -19.98% 4.96% -5.10% 0.78% 12.76% -6.00% 10.04% 8.13% 8.43% 8.45% 1.10% -3.32% -3.39% -7.40% 12.84% -0.83% -7.36% 8.64% -16.22% 6.15% -0.53% 16.06% 4.05% 2.36% -0.61% 3.98% 6.69% 8.98% -22.23% 4.02% -6.18% 0.08% 14.45% -9.52% 12.38% 10.23% 15.78% 8.46% 2.96% -0.43% -6.61% -13.34% 15.52% -2.04% -4.75% 12.25% -12.59% 26.88% 9.62% 17.35% -0.54% 3.86% -0.31% 1.77% 4.64% 3.25% -17.52% 6.32% -3.03% -1.78% 13.73% -7.25% 14.44% 12.76% 8.71% 8.09% 2.38% -1.03% -4.35% -11.39% 15.71% -1.97% -8.44% 11.15% -18.84% 14.59% 10.15% 17.79% 5.84% -2.17% -1.11% 2.93% 5.49% 5.42% -20.59% 5.12% -5.19% 0.09% 12.04% -5.57% 9.60% 6.86% 6.95% 8.58% 0.58% -3.78% -4.03% -6.99% 12.40% -1.75% -8.58% 8.04% -16.27% 3.49% -3.96% 16.08% 4.21% 1.58% 0.00% 0.01% 0.00% 0.00% 0.00% 0.03% 0.04% 0.05% 0.05% 0.11% 0.18% 0.21% 0.24% 0.32% 0.41% 0.44% 0.53% 0.61% 0.61% 0.55% 0.49% 0.37% 0.01% 0.03% 0.02% 0.01% 0.00% 0.01% Note: Information below is for all questions in this homework. Please do not use regressions to estimate alphas and betas. Instead, follow the below guideline to compute evaluation metrics. Sharpe Ratio: S, M Treynor Measure: use B = Cov(Tp.e. rm.)/Var(rm) Jensen Measure: use ap=r- ls + Bpm - 1)] Information Ratio: use Varex) = Varrot-[re+,(rm-")) Fabove denotes the sample average of re. Note that the risk-free rate is time dependent. Follow the lecture slides unless otherwise noted. Download the file HW3_Data.xls from Canvas - Modules - Homework 3. It contains the quarterly returns data on four actively managed mutual funds (AIG Hong Kong Equity Fund, BOCHK Investment Funds, Manulife Global Fund Dragon Growth Fund and Schroder ISF-Hong Kong Equity A), the Hang Seng Index, and the risk-free rate. 1. Rank order the four mutual funds (top to bottom) using the criterion of the Sharpe Ratio Schroder, Manulife, BOCHK, AIG Schroder, Manulife, AIG, BOCHK BOCHK, Schroder, Manulife, AIG BOCHK, Schroder, AIG, Manulife 2. Rank order the four mutual funds (top to bottom) using the criterion of the Treynor Measure Schroder, Manulife, BOCHK, AIG Schroder, Manulife, AIG, BOCHK BOCHK, Schroder, Manulife, AIG BOCHK, Schroder, AIG, Manulife 3. Rank order the four mutual funds (top to bottom) using the criterion of the Jensen's Alpha Schroder, Manulife, BOCHK, AIG Schroder, Manulife, AIG, BOCHK 0 0 0 0 BOCHK, Schroder, Manulife, AIG BOCHK, Schroder, AIG, Manulife 4. Rank order the four mutual funds (top to bottom) using the criterion of the Information Ratio Schroder, Manulife, BOCHK, AIG Schroder, Manulife, AIG, BOCHK BOCHK, Schroder, Manulife, AIG BOCHK, Schroder, AIG, Manulife 5. Rank order the four mutual funds (top to bottom) using the criterion of the M2 Measure Schroder, Manulife, BOCHK, AIG Schroder, Manulife, AIG, BOCHK BOCHK, Schroder, Manulife, AIG BOCHK, Schroder, AIG, Manulife Period -0.03% 1.12% 8.09% 2006 4th quarter 35 280 14.020 Quarterly Return AIG Hong Kong Equity Fun BOCHK Investment Funds-Hong Kong Equi Manulife Global Fund Dragon Growth Fund Schroder ISF - Hong Kong Equity Hang Seng Index Riskfree Rate (Bloomberg: PBIHKQI HK)|(BOCHKEA HK) (MNRIHKI LX Equity) (sCHHEAA LX) (quarterly rate) 13.05% 9.33% 11.94% 12.66% 6.24% 1.16% 1.4770 1.47% 2.68% 3.65% 2.93% % 8.53% 0.03 0.25% 8.25% 8.68% 7.84% 1.15% 21.17% 1370 21.17 14.45% 100 12.40% 21.49% 13.80% 1.18% 1.91% 3.36% w.ro 11 1917 09 6.78% 5.43% -0.82% 1.27% 13.65% . 11.06% de 12.03 13.09% 15.70% 9.96% 1.07% 30.54% 22.20% co 16.68% 23.96% 24.66% 0.83% 0.00% 6.51% 200 woro Windo 1.62% 3.59% 2.47% 0.66% -21.329 -17.95% -18.19% 1 . -15.01% -17.85% 0.29% -3.03% 4.42% -4.24% -2.36% -3.27% 0.39% -19.74% -20.20% -23.15% -27.98% -18.49% 0.14% -17.59% - 15.79% -21.11% -17.47% -20.14% 0.01% -3.11% -2.72% 1.78% can -2.56% 2000 -5.64% 0.04% 38.38% 33.03% 31.90% 43.61% 12.610 090 1970 0.03% 12.27% 120 12.85% 12.38% 23902 13.34% 090 0.02% 7.61% 6.74% 9.88% 8.58% % 4.38% 0.01% -2.71% -2.00% -1.27% 1.92% -2.89% -3.92% -5.49% -3.51% -5.23% 0.04% % 13.18% 13.94% 1.5.94% 15.31% 19.79% % 11.07% 0.04% % 2.2170 2.27% 1.90% % 3.81% 3.0170 2.85% 3.03% 0.02% 0.70% 1.40% 1.50% -0.78% W.7070 2.14% 0.02% 2.17 W.VEZ Tauro -4.60% -2.74% -3.19% -1.90% 3.1770 0.00% -4.80% 1.9070 -23.80% Duro -23.45% 22.1370 -26.31% 20.010 -21.99% -21.46% 0.00% 4.55% 5.88% 41.00 VO 3.86% 4.8.3% 4.79% 0.00% 7.96% T. 11.80% 11.24% 14.27% 11.51% 0.01% -3.92% 4.74% -7.48% -4.51% -5.42% 0.01% 7.47% 6.96% 6.11% 8.99% 7.20% 0.01% 6.99% 8.53% 9.97% 6.62% 8.72% 0.01% 0.66% -1.25% -0.80% 1.82% -1.58% 0.01% -4.38% 4.80% 4.80% -0.90% -4.95% 0.00% % 8.19% 9.13% 10.04% % 7.63% 9.89% 0.01% 7.51% 2.84% 9.21% 3.18% 1.95% 0.00% -4.03% -5.37% -1.91% -2.92% -4.96% 0.01% 3.40% 5.88% 2.06% 5.80% 4.69% 0.00% 2006 1st quarter 2006 2nd quarter 2006 3rd quarter . 2007 Ist quarter quantes 2007 2nd quarter an 2007 3rd quarter 1400 2007 4th quarter 2008 1st quarter 2nd 2008 2nd quarter 2008 3rd quarter w 2008 4th quarter 000 2009 1st quarter 2000 2009 2nd quarter 2000 2009 3rd quarter 2000 2009 4th quarter 2010 Ist quarter 2010 2nd quarter 2010 3rd quarter 2010 4th quarter 2011 1st quarter 2011 2nd quarter 2011 3rd quarter 2011 4th quarter 2012 Ist quarter 2012 2nd quarter 2012 3rd quarter 2012 4th quarter 2013 Ist quarter 2013 2nd quarter 2013 3rd quarter 2013 4th quarter 2014 1st quarter 2014 2nd quarter . 0.04% 8.47% -6.71% 2014 3rd quarter 2014 4th quarter 2015 1st quarter 2015 2nd quarter 2015 3rd quarter 2015 4th quarter 2016 1st quarter 2016 2nd quarter 2016 3rd quarter 2016 4th quarter 2017 1st quarter 2017 2nd quarter 2017 3rd quarter 2017 4th quarter 2018 1st quarter 2018 2nd quarter 2018 3rd quarter 2018 4th quarter 2019 1st quarter 2019 2nd quarter 2019 3rd quarter 2019 4th quarter 2020 1st quarter 2020 2nd quarter 2020 3rd quarter 2020 4th quarter 2021 1st quarter 2021 2nd quarter -1.31% 3.17% 3.47% 5.76% -20.55% 3.32% -8.28% -0.56% 10.69% -5.05% 9.67% 6.73% 8.08% 7.61% 0.73% -2.65% -4.12% -7.25% 12.35% -2.17% -6.83% 8.66% -15.31% 7.65% 5.07% 16.66% 1.86% -1.26% -1.29% 4.15% 6.75% 7.24% -19.98% 4.96% -5.10% 0.78% 12.76% -6.00% 10.04% 8.13% 8.43% 8.45% 1.10% -3.32% -3.39% -7.40% 12.84% -0.83% -7.36% 8.64% -16.22% 6.15% -0.53% 16.06% 4.05% 2.36% -0.61% 3.98% 6.69% 8.98% -22.23% 4.02% -6.18% 0.08% 14.45% -9.52% 12.38% 10.23% 15.78% 8.46% 2.96% -0.43% -6.61% -13.34% 15.52% -2.04% -4.75% 12.25% -12.59% 26.88% 9.62% 17.35% -0.54% 3.86% -0.31% 1.77% 4.64% 3.25% -17.52% 6.32% -3.03% -1.78% 13.73% -7.25% 14.44% 12.76% 8.71% 8.09% 2.38% -1.03% -4.35% -11.39% 15.71% -1.97% -8.44% 11.15% -18.84% 14.59% 10.15% 17.79% 5.84% -2.17% -1.11% 2.93% 5.49% 5.42% -20.59% 5.12% -5.19% 0.09% 12.04% -5.57% 9.60% 6.86% 6.95% 8.58% 0.58% -3.78% -4.03% -6.99% 12.40% -1.75% -8.58% 8.04% -16.27% 3.49% -3.96% 16.08% 4.21% 1.58% 0.00% 0.01% 0.00% 0.00% 0.00% 0.03% 0.04% 0.05% 0.05% 0.11% 0.18% 0.21% 0.24% 0.32% 0.41% 0.44% 0.53% 0.61% 0.61% 0.55% 0.49% 0.37% 0.01% 0.03% 0.02% 0.01% 0.00% 0.01% Note: Information below is for all questions in this homework. Please do not use regressions to estimate alphas and betas. Instead, follow the below guideline to compute evaluation metrics. Sharpe Ratio: S, M Treynor Measure: use B = Cov(Tp.e. rm.)/Var(rm) Jensen Measure: use ap=r- ls + Bpm - 1)] Information Ratio: use Varex) = Varrot-[re+,(rm-")) Fabove denotes the sample average of re. Note that the risk-free rate is time dependent. Follow the lecture slides unless otherwise noted. Download the file HW3_Data.xls from Canvas - Modules - Homework 3. It contains the quarterly returns data on four actively managed mutual funds (AIG Hong Kong Equity Fund, BOCHK Investment Funds, Manulife Global Fund Dragon Growth Fund and Schroder ISF-Hong Kong Equity A), the Hang Seng Index, and the risk-free rate. 1. Rank order the four mutual funds (top to bottom) using the criterion of the Sharpe Ratio Schroder, Manulife, BOCHK, AIG Schroder, Manulife, AIG, BOCHK BOCHK, Schroder, Manulife, AIG BOCHK, Schroder, AIG, Manulife 2. Rank order the four mutual funds (top to bottom) using the criterion of the Treynor Measure Schroder, Manulife, BOCHK, AIG Schroder, Manulife, AIG, BOCHK BOCHK, Schroder, Manulife, AIG BOCHK, Schroder, AIG, Manulife 3. Rank order the four mutual funds (top to bottom) using the criterion of the Jensen's Alpha Schroder, Manulife, BOCHK, AIG Schroder, Manulife, AIG, BOCHK 0 0 0 0 BOCHK, Schroder, Manulife, AIG BOCHK, Schroder, AIG, Manulife 4. Rank order the four mutual funds (top to bottom) using the criterion of the Information Ratio Schroder, Manulife, BOCHK, AIG Schroder, Manulife, AIG, BOCHK BOCHK, Schroder, Manulife, AIG BOCHK, Schroder, AIG, Manulife 5. Rank order the four mutual funds (top to bottom) using the criterion of the M2 Measure Schroder, Manulife, BOCHK, AIG Schroder, Manulife, AIG, BOCHK BOCHK, Schroder, Manulife, AIG BOCHK, Schroder, AIG, Manulife


