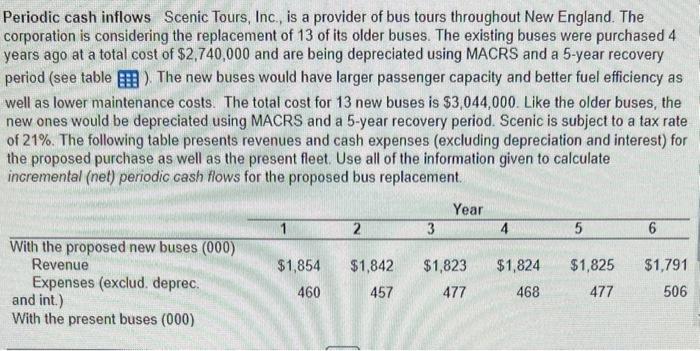
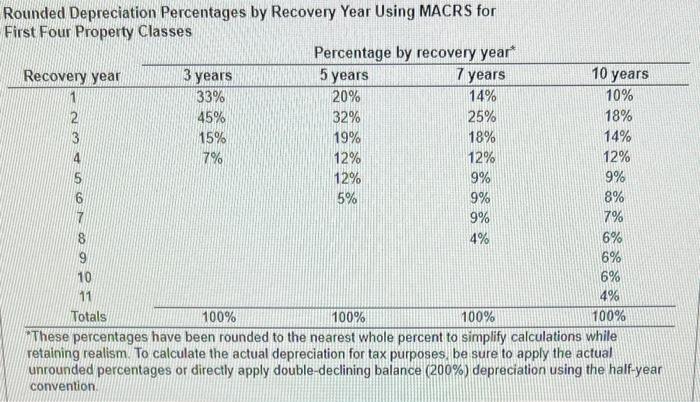
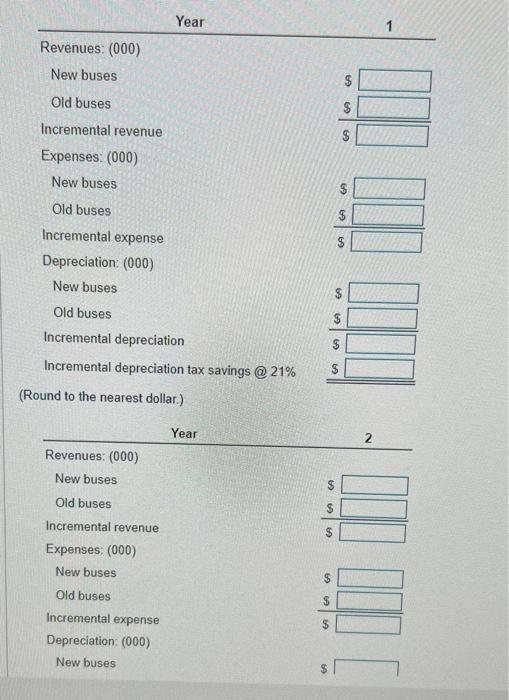
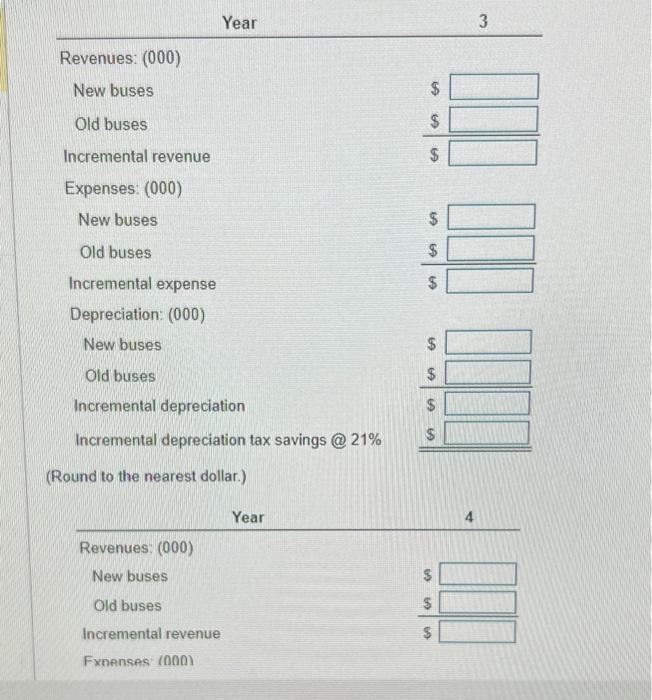
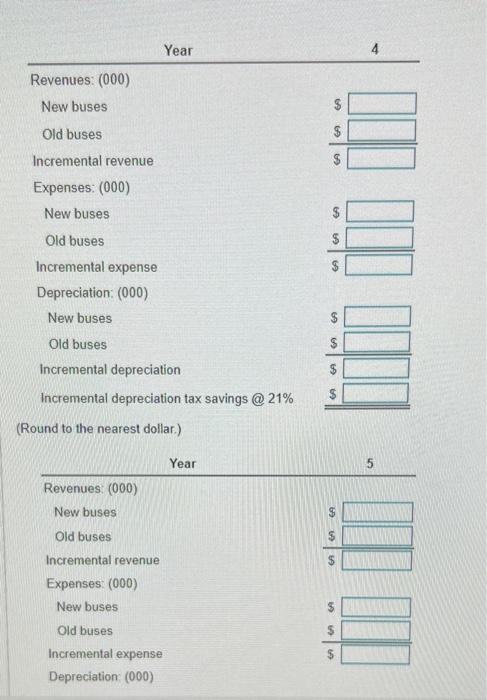
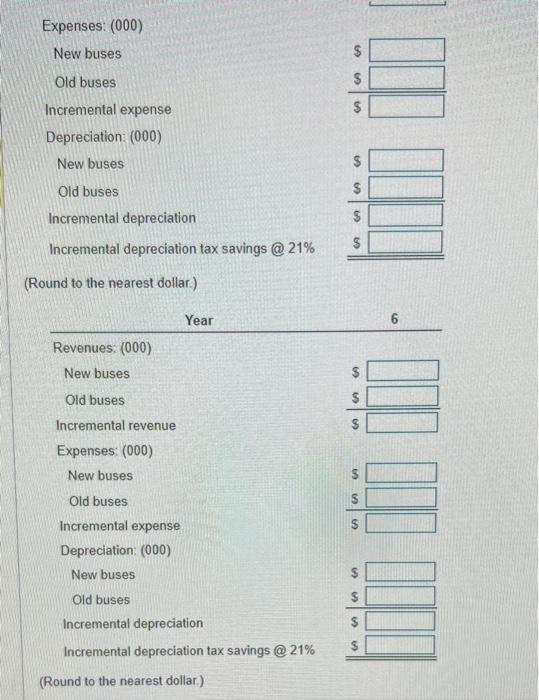
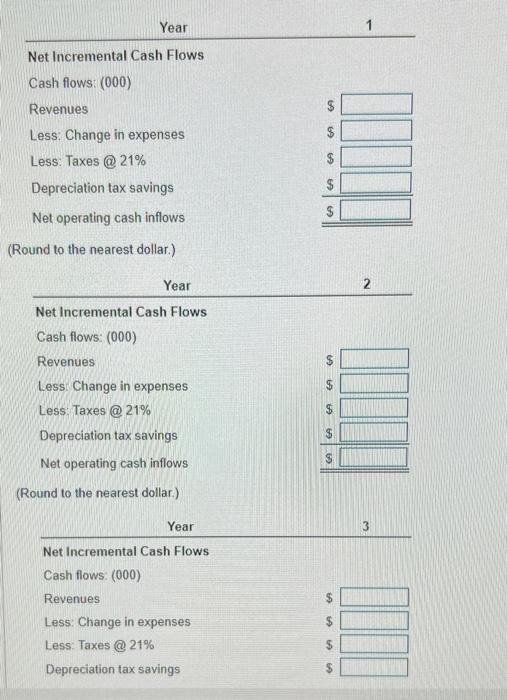
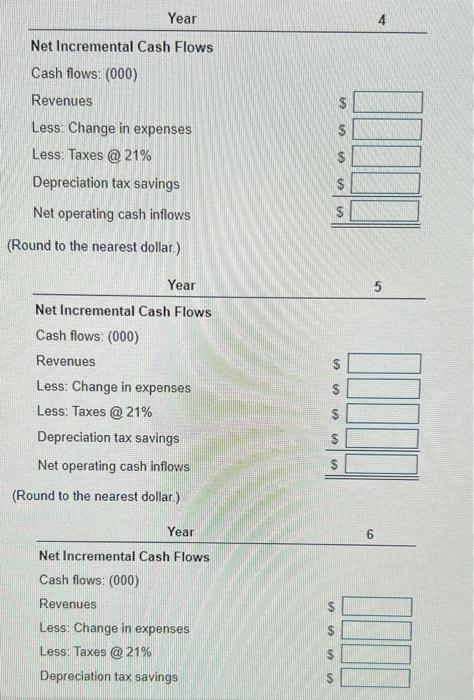
Periodic cash inflows Scenic Tours, Inc, is a provider of bus tours throughout New England. The corporation is considering the replacement of 13 of its older buses. The existing buses were purchased 4 years ago at a total cost of $2,740,000 and are being depreciated using MACRS and a 5-year recovery period (see table - ). The new buses would have larger passenger capacity and better fuel efficiency as well as lower maintenance costs. The total cost for 13 new buses is $3,044,000. Like the older buses, the new ones would be depreciated using MACRS and a 5-year recovery period. Scenic is subject to a tax rate of 21%. The following table presents revenues and cash expenses (excluding depreciation and interest) for the proposed purchase as well as the present fleet. Use all of the information given to calculate incremental (net) periodic cash flows for the proposed bus replacement. Rounded Depreciation Percentages by Recovery Year Using MACRS for First Four Property Classes unnese percentages nave deen rounded to tne nearest whole percent to simpury caicurauns wime retaining realism. To calculate the actual depreciation for tax purposes, be sure to apply the actual unrounded percentages or directly apply double-declining balance (200%) depreciation using the half-year convention. Year 1 Revenues: (000) New buses Old buses Incremental revenue Expenses: (000) New buses Old buses Incremental expense Depreciation: (000) New buses Old buses Incremental depreciation Incremental depreciation tax savings @ 21\% $ (Round to the nearest dollar.) Revenues: (000) New buses Old buses Incremental revenue Expenses: (000) New buses Old buses Incremental expense Depreciation: (000) New buses \begin{tabular}{ll} Year & 3 \\ \hline \end{tabular} Revenues: (000) New buses Old buses Incremental revenue Expenses: (000) New buses Old buses Incremental expense Depreciation: (000) New buses Old buses Incremental depreciation Incremental depreciation tax savings @ 21\% (Round to the nearest dollar.) Fxnenses: (0nn) Year 4 Revenues: (000) New buses Old buses Incremental revenue Expenses: (000) New buses Old buses Incremental expense Depreciation: (000) New buses Old buses Incremental depreciation Incremental depreciation tax savings @ 21\% \$ $ (Round to the nearest dollar.) \begin{tabular}{ccc} Year & 5 \\ \hline \end{tabular} Revenues: (000) New buses Old buses Incremental revenue Expenses: (000) New buses Old buses Incremental expense Depreciation (000) Expenses: (000) New buses Old buses Incremental expense Depreciation: (000) New buses Old buses Incremental depreciation Incremental depreciation tax savings @ 21\% (Round to the nearest dollar.) \begin{tabular}{lll} Year & 6 \\ \hline \end{tabular} Revenues: (000) New buses Old buses Incremental revenue Expenses: (000) New buses Old buses Incremental expense Depreciation: (000) New buses Old buses Incremental depreciation Incremental depreciation tax savings @ 21\% (Round to the nearest dollar.) Year 1 Net lncremental Cash Flows Cash flows: (000) Revenues Less: Change in expenses Less:Taxes @ 21\% Depreciation tax savings Net operating cash inflows (Round to the nearest dollar.) Year 2 Net Incremental Cash Flows Cash flows: (000) Revenues Less Change in expenses Less:Taxes@21\% Depreciation tax savings Net operating cash inflows (Round to the nearest dollar.) \begin{tabular}{c|c} Year & 3 \\ \hline \end{tabular} Net Incremental Cash Flows Cash flows: (000) Revenues Less: Change in expenses Less: Taxes@21\% Depreciation tax savings \begin{tabular}{ll} Year & 4 \\ \hline \end{tabular} Net Incremental Cash Flows Cash flows: (000) Revenues Less: Change in expenses Less:Taxes@21\% Depreciation tax savings Net operating cash inflows (Round to the nearest dollar.) \begin{tabular}{ll} Year & 5 \\ \hline \end{tabular} Net Incremental Cash Flows Cash flows: (000) Revenues Less: Change in expenses Less: Taxes @ 21\% Depreciation tax savings Net operating cash inflows (Round to the nearest dollar.) \begin{tabular}{ll} Year & 6 \\ \hline \end{tabular} Net Incremental Cash Flows Cash flows: (000) Revenues Less: Change in expenses Less: Taxes @ 21\% Depreciation tax savings Periodic cash inflows Scenic Tours, Inc, is a provider of bus tours throughout New England. The corporation is considering the replacement of 13 of its older buses. The existing buses were purchased 4 years ago at a total cost of $2,740,000 and are being depreciated using MACRS and a 5-year recovery period (see table - ). The new buses would have larger passenger capacity and better fuel efficiency as well as lower maintenance costs. The total cost for 13 new buses is $3,044,000. Like the older buses, the new ones would be depreciated using MACRS and a 5-year recovery period. Scenic is subject to a tax rate of 21%. The following table presents revenues and cash expenses (excluding depreciation and interest) for the proposed purchase as well as the present fleet. Use all of the information given to calculate incremental (net) periodic cash flows for the proposed bus replacement. Rounded Depreciation Percentages by Recovery Year Using MACRS for First Four Property Classes unnese percentages nave deen rounded to tne nearest whole percent to simpury caicurauns wime retaining realism. To calculate the actual depreciation for tax purposes, be sure to apply the actual unrounded percentages or directly apply double-declining balance (200%) depreciation using the half-year convention. Year 1 Revenues: (000) New buses Old buses Incremental revenue Expenses: (000) New buses Old buses Incremental expense Depreciation: (000) New buses Old buses Incremental depreciation Incremental depreciation tax savings @ 21\% $ (Round to the nearest dollar.) Revenues: (000) New buses Old buses Incremental revenue Expenses: (000) New buses Old buses Incremental expense Depreciation: (000) New buses \begin{tabular}{ll} Year & 3 \\ \hline \end{tabular} Revenues: (000) New buses Old buses Incremental revenue Expenses: (000) New buses Old buses Incremental expense Depreciation: (000) New buses Old buses Incremental depreciation Incremental depreciation tax savings @ 21\% (Round to the nearest dollar.) Fxnenses: (0nn) Year 4 Revenues: (000) New buses Old buses Incremental revenue Expenses: (000) New buses Old buses Incremental expense Depreciation: (000) New buses Old buses Incremental depreciation Incremental depreciation tax savings @ 21\% \$ $ (Round to the nearest dollar.) \begin{tabular}{ccc} Year & 5 \\ \hline \end{tabular} Revenues: (000) New buses Old buses Incremental revenue Expenses: (000) New buses Old buses Incremental expense Depreciation (000) Expenses: (000) New buses Old buses Incremental expense Depreciation: (000) New buses Old buses Incremental depreciation Incremental depreciation tax savings @ 21\% (Round to the nearest dollar.) \begin{tabular}{lll} Year & 6 \\ \hline \end{tabular} Revenues: (000) New buses Old buses Incremental revenue Expenses: (000) New buses Old buses Incremental expense Depreciation: (000) New buses Old buses Incremental depreciation Incremental depreciation tax savings @ 21\% (Round to the nearest dollar.) Year 1 Net lncremental Cash Flows Cash flows: (000) Revenues Less: Change in expenses Less:Taxes @ 21\% Depreciation tax savings Net operating cash inflows (Round to the nearest dollar.) Year 2 Net Incremental Cash Flows Cash flows: (000) Revenues Less Change in expenses Less:Taxes@21\% Depreciation tax savings Net operating cash inflows (Round to the nearest dollar.) \begin{tabular}{c|c} Year & 3 \\ \hline \end{tabular} Net Incremental Cash Flows Cash flows: (000) Revenues Less: Change in expenses Less: Taxes@21\% Depreciation tax savings \begin{tabular}{ll} Year & 4 \\ \hline \end{tabular} Net Incremental Cash Flows Cash flows: (000) Revenues Less: Change in expenses Less:Taxes@21\% Depreciation tax savings Net operating cash inflows (Round to the nearest dollar.) \begin{tabular}{ll} Year & 5 \\ \hline \end{tabular} Net Incremental Cash Flows Cash flows: (000) Revenues Less: Change in expenses Less: Taxes @ 21\% Depreciation tax savings Net operating cash inflows (Round to the nearest dollar.) \begin{tabular}{ll} Year & 6 \\ \hline \end{tabular} Net Incremental Cash Flows Cash flows: (000) Revenues Less: Change in expenses Less: Taxes @ 21\% Depreciation tax savings