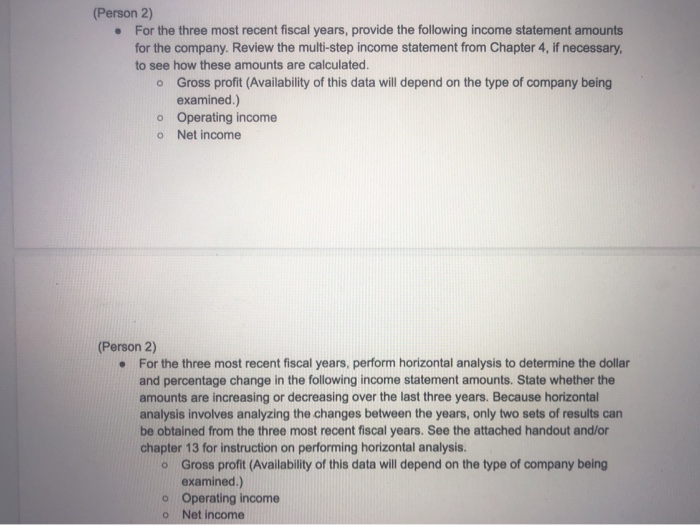
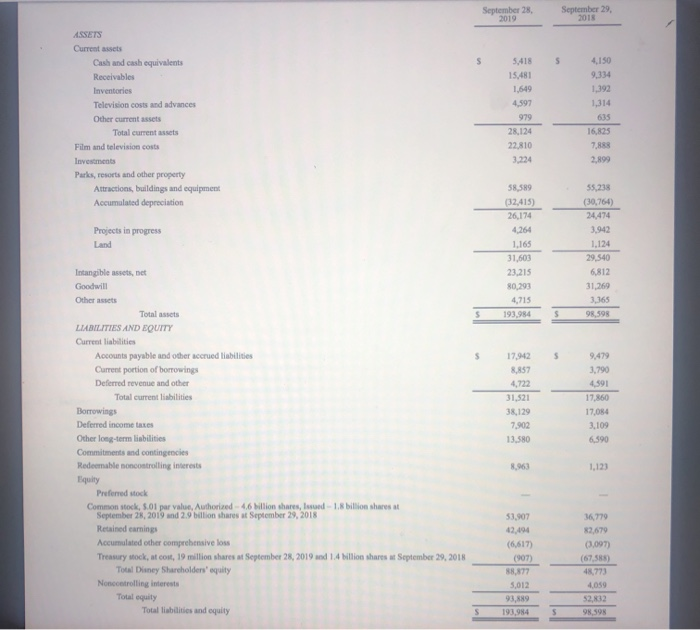
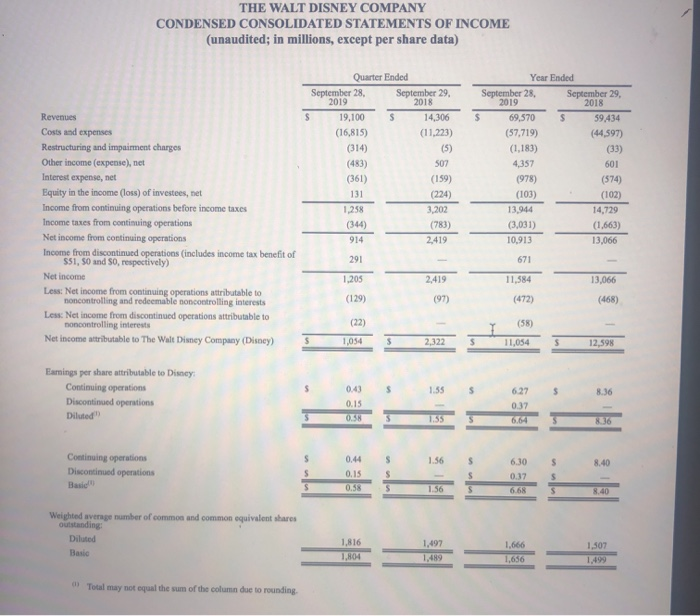
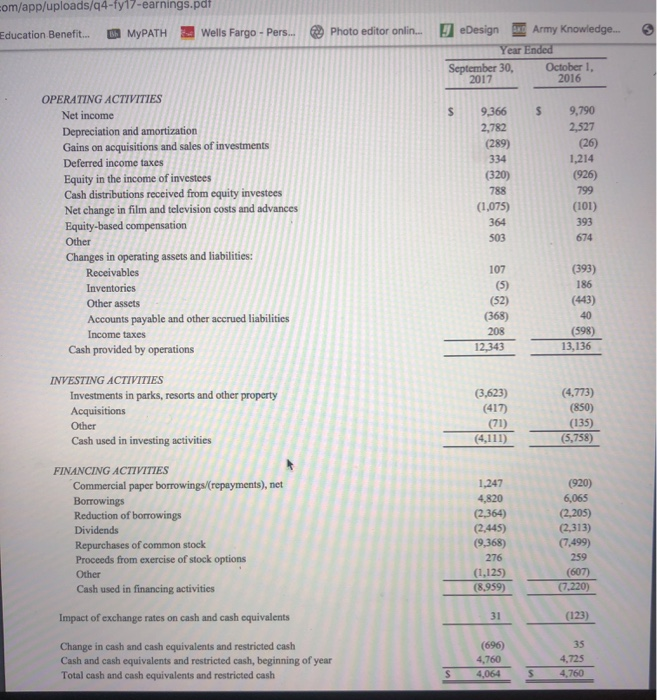
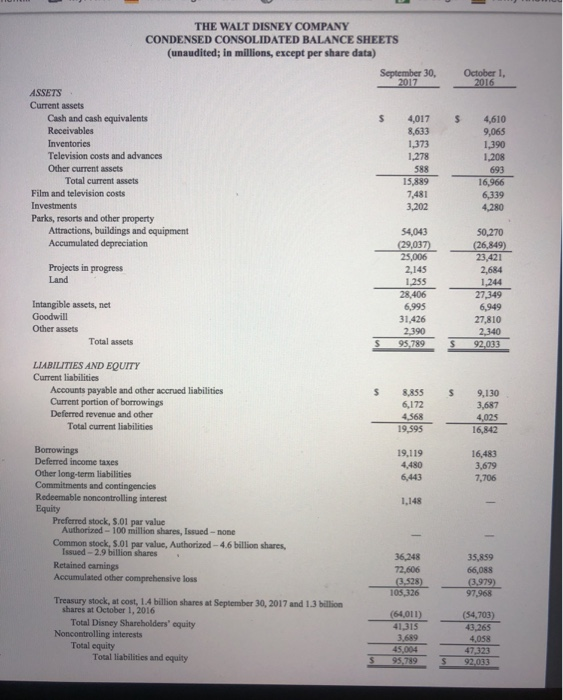
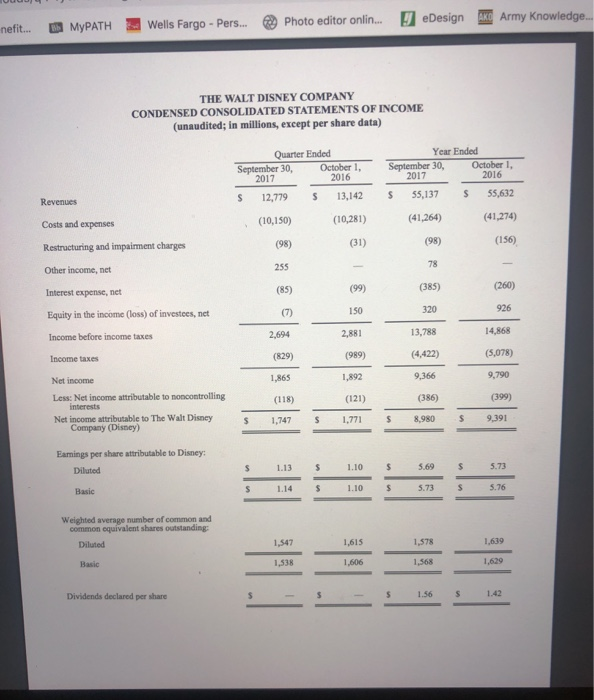
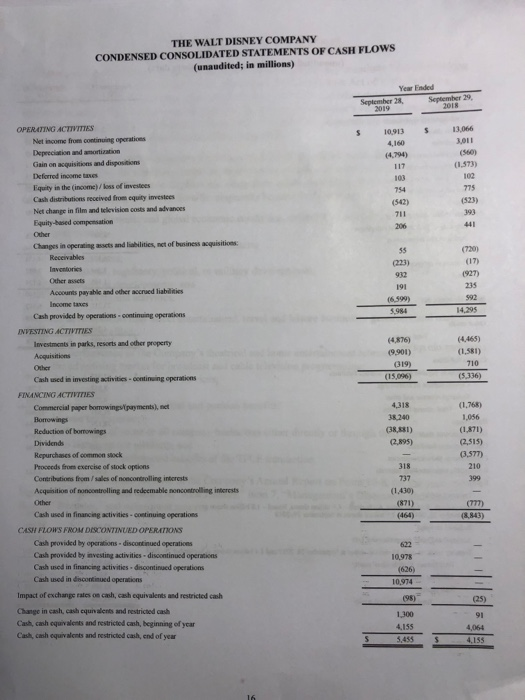
(Person 2) For the three most recent fiscal years, provide the following income statement amounts for the company. Review the multi-step income statement from Chapter 4, if necessary, to see how these amounts are calculated. Gross profit (Availability of this data will depend on the type of company being examined.) o Operating income Net income (Person 2) For the three most recent fiscal years, perform horizontal analysis to determine the dollar and percentage change in the following income statement amounts. State whether the amounts are increasing or decreasing over the last three years. Because horizontal analysis involves analyzing the changes between the years, only two sets of results can be obtained from the three most recent fiscal years. See the attached handout and/or chapter 13 for instruction on performing horizontal analysis. 0 Gross profit (Availability of this data will depend on the type of company being examined.) o Operating income o Net income September 28, 2019 September 29, 2018 5 5,418 154 4,150 9.334 1.549 4.597 ASSETS Current assets Cash and cash equivalents Receivables Inventories Television costs and advances Other current assets Total current assets Film and television costs Investments Parks, resorts and other property Attractions, buildings and equipment Accumulated depreciation 979 635 16,825 28.124 22,810 3.224 7,888 2,899 58,589 (32,415) 26.174 4,264 1.165 Projects in progress Land 55.238 (30.764) 24,474 3,942 1.124 29.540 6.812 31.269 3,365 98,598 23.215 80,293 4,715 193.984 17,942 Intangible assets, net Goodwill Other assets Total assets LIABILITIES AND EQUITY Current liabilities Accounts payable and other accrued liabilities Current portion of borrowings Deferred revenue and other Total current liabilities Borrowings Deferred income taxes Other long-term liabilities Commitments and contingencies Redeemable no controlling interests 4,722 31,521 38,129 7002 13.580 9,479 3,790 4.591 17.860 17.084 3.109 6,590 63 1,123 Preferred stock Common stock, 5.01 par value, Authorized 46 Million shares, son 1,8 billion sharest September 28, 2019 and 2.9 billion shares September 29, 2018 Retained earnings Accumulated other comprehensive loss Treasury stock, at cost, 19 million shares at September 28, 2019 and 1.4 billion shares at September 29, 2018 Total Disney Shareholders' equity Noncontrolling interests Total equity Total liabilities and equity 51.907 42,494 (6,617) (907) 88,877 36,779 82.679 (3,097) (67.585 48.773 1012 93,889 193.984 S THE WALT DISNEY COMPANY CONDENSED CONSOLIDATED STATEMENTS OF INCOME (unaudited; in millions, except per share data) Quarter Ended September 28. September 29. 2019 19,100 $ 14,306 (16,815) (11,223) (314) (5) (33) 507 Year Ended September 28. September 29, 2019 2018 69.570 59.434 (57,719) (44,597) (1,183) 4,357 601 (978) (574) (103) (102) 13.944 14,729 (3,031) (1.663) 10.913 13,066 (361) (159) (224) Revenues Costs and expenses Restructuring and impairment charges Other income (expense), net Interest expense, net Equity in the income (loss) of investees, net Income from continuing operations before income taxes Income taxes from continuing operations Net income from continuing operations Income from discontinued operations includes income tax benefit of 551, 50 and So, respectively) Net income Less: Net income from continuing operations attributable to noncontrolling and redeemable no controlling interests Less: Net income from discontinued operations attributable to noncontrolling interests Net income attributable to The Walt Disney Company (Disney) (344) 671 11,584 13,066 (472) (468) 1,205 (129) (22) 1,054 (58) $ 5 S 11.054 12,598 Earnings per share attributable to Disney Continuing operations Discontinued operations Diluted" 0.43 6.27 $ 8.36 nh Continuing operations Discontinued operations Basic Weighted average number of common and common equivalent shares Outstanding Diluted Basic Total may not equal the sum of the column due to rounding com/app/uploads/q4-ty17-earnings.pdf Education Benefit... Ba MyPATH Wells Fargo - Pers... Photo editor onlin... 3 eDesign e Army Knowledge... Year Ended September 30, October 1, 2017 2016 OPERATING ACTIVITIES Net income Depreciation and amortization Gains on acquisitions and sales of investments Deferred income taxes Equity in the income of investees Cash distributions received from equity investees Net change in film and television costs and advances Equity-based compensation Other Changes in operating assets and liabilities: Receivables Inventories Other assets Accounts payable and other accrued liabilities Income taxes Cash provided by operations 9,366 2,782 (289) 334 (320) 788 (1,075) 364 9,790 2,527 (26) 1,214 (926) 799 (101) 393 674 107 (393) 186 (443) (5) (52) (368) 208 12,343 (598) 13,136 INVESTING ACTIVITIES Investments in parks, resorts and other property Acquisitions Other Cash used in investing activities (3,623) (417) (71) (4,773) (850) (135) (5,758) FINANCING ACTIVITIES Commercial paper borrowings/(repayments), net Borrowings Reduction of borrowings Dividends Repurchases of common stock Proceeds from exercise of stock options Other Cash used in financing activities 1,247 4,820 (2,364) (2,445) (9,368) 276 (1.125) (8.959) (920) 6,065 (2.205) (2,313) (7,499) 259 (607) (7.220) Impact of exchange rates on cash and cash equivalents (123) 696 Change in cash and cash equivalents and restricted cash Cash and cash equivalents and restricted cash, beginning of year Total cash and cash equivalents and restricted cash 4,760 4,064 4,760 THE WALT DISNEY COMPANY CONDENSED CONSOLIDATED STATEMENTS OF CASH FLOWS (unaudited; in millions) Year Ended September 28 September 29, 10.913 S 13.066 3,011 (4.794) (1573) 775 (523) (542) 711 206 OPERATING ACTIVITIES Net income from continuing operations Depreciation and amortization Gain on acquisitions and dispositions Deferred income taxes Equity in the income) / loss of investees Cash distributions received from equity investees Net change in film and television costs and advances Equity-based compensation Other Changes in operating assets and liabilities, net of business acquisitions: Receivables Inventories Other assets Accounts payable and other socrued liabilities Income taxes Cash provided by operations continuing operations INVESTING ACTIVITIES Investments in parks, resorts and other property Acquisitions (7201 (17) 1927) 215 191 (6.590) 5,984 14,295 (4.465) (1.581) (4876) (9.901) (319) (15 ) 710 Other Cash used in investing activities continuing operations (5.336) 4,318 38.240 (38,881) (2,895) (1.768) 1,056 (1.871) (2.515) (3.577) 318 FINANCING ACTIVITIES Commercial paper borrowings/payments), net Borrowings Reduction of borrowings Dividends Repurchases of common stock Proceeds from exercise of stock options Contributions from sales of no controlling interests Acquisition of no controlling and redeemable no controlling interests Other Cash used in financing activities continuing operations CASH FLOWS FROM DESCONTINUED OPERATIONS Cash provided by operations discontinued operations Cash provided by investing activities - discontinued operations Cash used in financing activities discontinued operations Cached in discontinued operations 737 (1.430) (871) (464) 10,978 (626) 10.974 Impact of exchange rates on cash, cash equivalents and restricted cash (98) 1,300 Change in cash, cash cqualents and restricted cash Cash, cash equivalents and restricted cash, beginning of year Clash, cash equivalents and restricted cash, end of year (Person 2) For the three most recent fiscal years, provide the following income statement amounts for the company. Review the multi-step income statement from Chapter 4, if necessary, to see how these amounts are calculated. Gross profit (Availability of this data will depend on the type of company being examined.) o Operating income Net income (Person 2) For the three most recent fiscal years, perform horizontal analysis to determine the dollar and percentage change in the following income statement amounts. State whether the amounts are increasing or decreasing over the last three years. Because horizontal analysis involves analyzing the changes between the years, only two sets of results can be obtained from the three most recent fiscal years. See the attached handout and/or chapter 13 for instruction on performing horizontal analysis. 0 Gross profit (Availability of this data will depend on the type of company being examined.) o Operating income o Net income September 28, 2019 September 29, 2018 5 5,418 154 4,150 9.334 1.549 4.597 ASSETS Current assets Cash and cash equivalents Receivables Inventories Television costs and advances Other current assets Total current assets Film and television costs Investments Parks, resorts and other property Attractions, buildings and equipment Accumulated depreciation 979 635 16,825 28.124 22,810 3.224 7,888 2,899 58,589 (32,415) 26.174 4,264 1.165 Projects in progress Land 55.238 (30.764) 24,474 3,942 1.124 29.540 6.812 31.269 3,365 98,598 23.215 80,293 4,715 193.984 17,942 Intangible assets, net Goodwill Other assets Total assets LIABILITIES AND EQUITY Current liabilities Accounts payable and other accrued liabilities Current portion of borrowings Deferred revenue and other Total current liabilities Borrowings Deferred income taxes Other long-term liabilities Commitments and contingencies Redeemable no controlling interests 4,722 31,521 38,129 7002 13.580 9,479 3,790 4.591 17.860 17.084 3.109 6,590 63 1,123 Preferred stock Common stock, 5.01 par value, Authorized 46 Million shares, son 1,8 billion sharest September 28, 2019 and 2.9 billion shares September 29, 2018 Retained earnings Accumulated other comprehensive loss Treasury stock, at cost, 19 million shares at September 28, 2019 and 1.4 billion shares at September 29, 2018 Total Disney Shareholders' equity Noncontrolling interests Total equity Total liabilities and equity 51.907 42,494 (6,617) (907) 88,877 36,779 82.679 (3,097) (67.585 48.773 1012 93,889 193.984 S THE WALT DISNEY COMPANY CONDENSED CONSOLIDATED STATEMENTS OF INCOME (unaudited; in millions, except per share data) Quarter Ended September 28. September 29. 2019 19,100 $ 14,306 (16,815) (11,223) (314) (5) (33) 507 Year Ended September 28. September 29, 2019 2018 69.570 59.434 (57,719) (44,597) (1,183) 4,357 601 (978) (574) (103) (102) 13.944 14,729 (3,031) (1.663) 10.913 13,066 (361) (159) (224) Revenues Costs and expenses Restructuring and impairment charges Other income (expense), net Interest expense, net Equity in the income (loss) of investees, net Income from continuing operations before income taxes Income taxes from continuing operations Net income from continuing operations Income from discontinued operations includes income tax benefit of 551, 50 and So, respectively) Net income Less: Net income from continuing operations attributable to noncontrolling and redeemable no controlling interests Less: Net income from discontinued operations attributable to noncontrolling interests Net income attributable to The Walt Disney Company (Disney) (344) 671 11,584 13,066 (472) (468) 1,205 (129) (22) 1,054 (58) $ 5 S 11.054 12,598 Earnings per share attributable to Disney Continuing operations Discontinued operations Diluted" 0.43 6.27 $ 8.36 nh Continuing operations Discontinued operations Basic Weighted average number of common and common equivalent shares Outstanding Diluted Basic Total may not equal the sum of the column due to rounding com/app/uploads/q4-ty17-earnings.pdf Education Benefit... Ba MyPATH Wells Fargo - Pers... Photo editor onlin... 3 eDesign e Army Knowledge... Year Ended September 30, October 1, 2017 2016 OPERATING ACTIVITIES Net income Depreciation and amortization Gains on acquisitions and sales of investments Deferred income taxes Equity in the income of investees Cash distributions received from equity investees Net change in film and television costs and advances Equity-based compensation Other Changes in operating assets and liabilities: Receivables Inventories Other assets Accounts payable and other accrued liabilities Income taxes Cash provided by operations 9,366 2,782 (289) 334 (320) 788 (1,075) 364 9,790 2,527 (26) 1,214 (926) 799 (101) 393 674 107 (393) 186 (443) (5) (52) (368) 208 12,343 (598) 13,136 INVESTING ACTIVITIES Investments in parks, resorts and other property Acquisitions Other Cash used in investing activities (3,623) (417) (71) (4,773) (850) (135) (5,758) FINANCING ACTIVITIES Commercial paper borrowings/(repayments), net Borrowings Reduction of borrowings Dividends Repurchases of common stock Proceeds from exercise of stock options Other Cash used in financing activities 1,247 4,820 (2,364) (2,445) (9,368) 276 (1.125) (8.959) (920) 6,065 (2.205) (2,313) (7,499) 259 (607) (7.220) Impact of exchange rates on cash and cash equivalents (123) 696 Change in cash and cash equivalents and restricted cash Cash and cash equivalents and restricted cash, beginning of year Total cash and cash equivalents and restricted cash 4,760 4,064 4,760 THE WALT DISNEY COMPANY CONDENSED CONSOLIDATED STATEMENTS OF CASH FLOWS (unaudited; in millions) Year Ended September 28 September 29, 10.913 S 13.066 3,011 (4.794) (1573) 775 (523) (542) 711 206 OPERATING ACTIVITIES Net income from continuing operations Depreciation and amortization Gain on acquisitions and dispositions Deferred income taxes Equity in the income) / loss of investees Cash distributions received from equity investees Net change in film and television costs and advances Equity-based compensation Other Changes in operating assets and liabilities, net of business acquisitions: Receivables Inventories Other assets Accounts payable and other socrued liabilities Income taxes Cash provided by operations continuing operations INVESTING ACTIVITIES Investments in parks, resorts and other property Acquisitions (7201 (17) 1927) 215 191 (6.590) 5,984 14,295 (4.465) (1.581) (4876) (9.901) (319) (15 ) 710 Other Cash used in investing activities continuing operations (5.336) 4,318 38.240 (38,881) (2,895) (1.768) 1,056 (1.871) (2.515) (3.577) 318 FINANCING ACTIVITIES Commercial paper borrowings/payments), net Borrowings Reduction of borrowings Dividends Repurchases of common stock Proceeds from exercise of stock options Contributions from sales of no controlling interests Acquisition of no controlling and redeemable no controlling interests Other Cash used in financing activities continuing operations CASH FLOWS FROM DESCONTINUED OPERATIONS Cash provided by operations discontinued operations Cash provided by investing activities - discontinued operations Cash used in financing activities discontinued operations Cached in discontinued operations 737 (1.430) (871) (464) 10,978 (626) 10.974 Impact of exchange rates on cash, cash equivalents and restricted cash (98) 1,300 Change in cash, cash cqualents and restricted cash Cash, cash equivalents and restricted cash, beginning of year Clash, cash equivalents and restricted cash, end of year
