Person who helped with last two questions. I cannot see the Excel link, I need access to see the answers please check email to give me access to the Excel.
Birth quarter Q1, birthday February 9th.
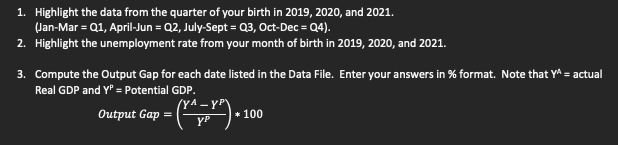
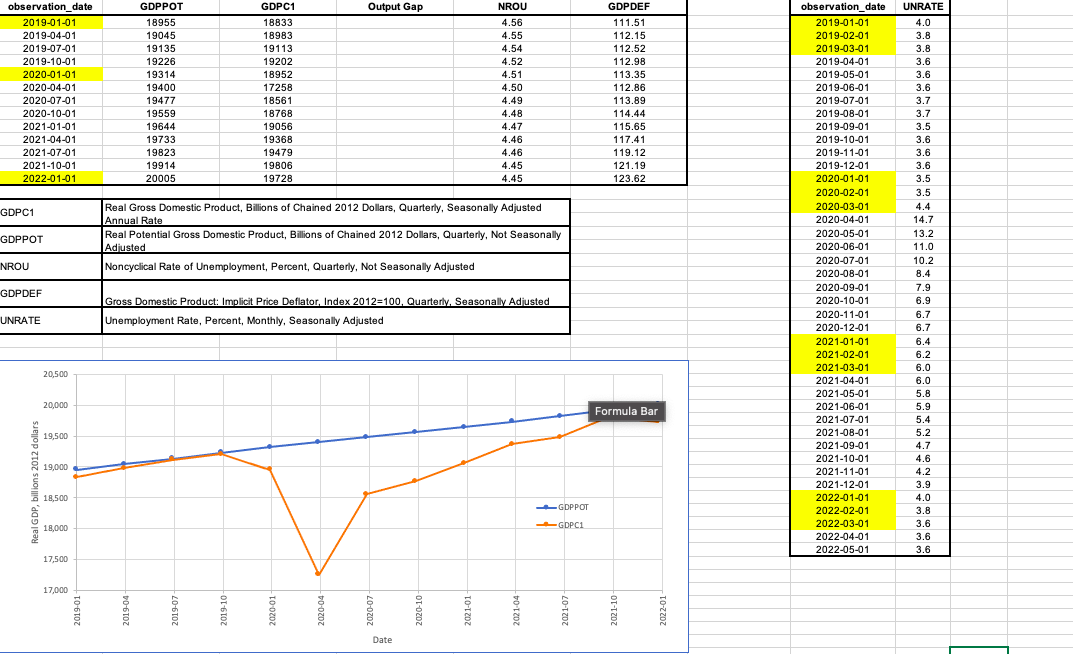
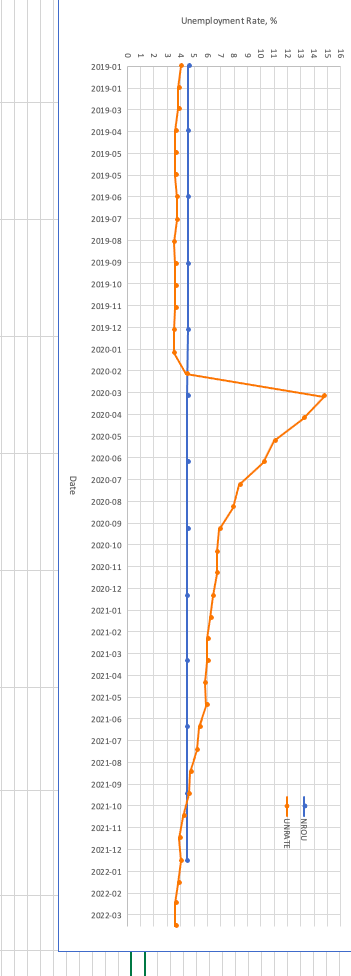
1. Highlight the data from the quarter of your birth in 2019, 2020, and 2021. (Jan-Mar = Q1, April-Jun = Q2, July-Sept = Q3, Oct-Dec = Q4). 2. Highlight the unemployment rate from your month of birth in 2019, 2020, and 2021. 3. Compute the Output Gap for each date listed in the Data File. Enter your answers in % format. Note that Y^ = actual Real GDP and Y = Potential GDP. Output Gap = - (YA_-_Y"). * 100 observation_date 2019-01-01 2019-04-01 2019-07-01 2019-10-01 2020-01-01 2020-04-01 2020-07-01 2020-10-01 2021-01-01 2021-04-01 2021-07-01 2021-10-01 2022-01-01 GDPC1 GDPPOT NROU GDPDEF UNRATE 20,500 20,000 19,500 19,000 18,500 18,000 17,500 17,000 @ GDPPOT 18955 19045 19135 19226 19314 19400 19477 19559 19644 19733 19823 8 702 19914 20005 GDPC1 18833 18983 19113 19202 18952 17258 18561 18768 19056 19368 19479 19806 19728 Output Gap Real Gross Domestic Product, Billions of Chained 2012 Dollars, Quarterly, Seasonally Adjusted Annual Rate Real Potential Gross Domestic Product, Billions of Chained 2012 Dollars, Quarterly, Not Seasonally Adjusted Noncyclical Rate of Unemployment, Percent, Quarterly, Not Seasonally Adjusted Gross Domestic Product: Implicit Price Deflator, Index 2012-100, Quarterly, Seasonally Adjusted Unemployment Rate, Percent, Monthly, Seasonally Adjusted 2020-04+ NROU 4.56 4.55 4.54 4.52 4.51 4.50 4.49 4.48 4.47 4.46 4.46 4.45 4.45 Date 2020-10+ -GDPPOT GDPC1 GDPDEF 111.51 112.15 112.52 112.98 113.35 112.86 113.89 114.44 115.65 117.41 119.12 121.19 123.62 Formula Bar observation_date UNRATE 2019-01-01 2019-02-01 2019-03-01 2019-04-01 2019-05-01 2019-06-01 2019-07-01 2019-08-01 2019-09-01 2019-10-01 2019-11-01 2019-12-01 2020-01-01 2020-02-01 2020-03-01 2020-04-01 2020-05-01 2020-06-01 2020-07-01 2020-08-01 2020-09-01 2020-10-01 2020-11-01 2020-12-01 2021-01-01 2021-02-01 2021-03-01 2021-04-01 2021-05-01 2021-06-01 2021-07-01 2021-08-01 2021-09-01 2021-10-01 2021-11-01 2021-12-01 2022-01-01 2022-02-01 2022-03-01 2022-04-01 2022-05-01 4.0 3.8 3.8 3.6 3.6 3.6 3.7 3.7 3.5 3.6 3.6 3.6 3.5 3.5 4.4 14.7 13.2 11.0 10.2 8.4 7.9 6.9 6.7 6.7 6.4 6.2 6.0 6.0 5.8 5.9 5.4 5.2 4.7 4.6 4.2 3.9 4.0 3.8 3.6 3.6 3.6 2019-01 2019-01 2019-03 2019-04 2019-05 2019-05 2019-06 2019-07 2019-08 2019-09 2019-10 2019-11 2019-12 2020-01 2020-02 2020-03 2020-04 2020-05 2020-06 2020-07 2020-08 2020-09 2020-10 2020-11 2020-12 2021-01 2021-02 2021-03 2021-04 2021-05 2021-06 2021-07 2021-08 2021-09 2021-10 2021-11 2021-12 2022-01 2022-02 2022-03 Unemployment Rate, % OHNWA uno VOS SERES N UNDAT 1. Highlight the data from the quarter of your birth in 2019, 2020, and 2021. (Jan-Mar = Q1, April-Jun = Q2, July-Sept = Q3, Oct-Dec = Q4). 2. Highlight the unemployment rate from your month of birth in 2019, 2020, and 2021. 3. Compute the Output Gap for each date listed in the Data File. Enter your answers in % format. Note that Y^ = actual Real GDP and Y = Potential GDP. Output Gap = - (YA_-_Y"). * 100 observation_date 2019-01-01 2019-04-01 2019-07-01 2019-10-01 2020-01-01 2020-04-01 2020-07-01 2020-10-01 2021-01-01 2021-04-01 2021-07-01 2021-10-01 2022-01-01 GDPC1 GDPPOT NROU GDPDEF UNRATE 20,500 20,000 19,500 19,000 18,500 18,000 17,500 17,000 @ GDPPOT 18955 19045 19135 19226 19314 19400 19477 19559 19644 19733 19823 8 702 19914 20005 GDPC1 18833 18983 19113 19202 18952 17258 18561 18768 19056 19368 19479 19806 19728 Output Gap Real Gross Domestic Product, Billions of Chained 2012 Dollars, Quarterly, Seasonally Adjusted Annual Rate Real Potential Gross Domestic Product, Billions of Chained 2012 Dollars, Quarterly, Not Seasonally Adjusted Noncyclical Rate of Unemployment, Percent, Quarterly, Not Seasonally Adjusted Gross Domestic Product: Implicit Price Deflator, Index 2012-100, Quarterly, Seasonally Adjusted Unemployment Rate, Percent, Monthly, Seasonally Adjusted 2020-04+ NROU 4.56 4.55 4.54 4.52 4.51 4.50 4.49 4.48 4.47 4.46 4.46 4.45 4.45 Date 2020-10+ -GDPPOT GDPC1 GDPDEF 111.51 112.15 112.52 112.98 113.35 112.86 113.89 114.44 115.65 117.41 119.12 121.19 123.62 Formula Bar observation_date UNRATE 2019-01-01 2019-02-01 2019-03-01 2019-04-01 2019-05-01 2019-06-01 2019-07-01 2019-08-01 2019-09-01 2019-10-01 2019-11-01 2019-12-01 2020-01-01 2020-02-01 2020-03-01 2020-04-01 2020-05-01 2020-06-01 2020-07-01 2020-08-01 2020-09-01 2020-10-01 2020-11-01 2020-12-01 2021-01-01 2021-02-01 2021-03-01 2021-04-01 2021-05-01 2021-06-01 2021-07-01 2021-08-01 2021-09-01 2021-10-01 2021-11-01 2021-12-01 2022-01-01 2022-02-01 2022-03-01 2022-04-01 2022-05-01 4.0 3.8 3.8 3.6 3.6 3.6 3.7 3.7 3.5 3.6 3.6 3.6 3.5 3.5 4.4 14.7 13.2 11.0 10.2 8.4 7.9 6.9 6.7 6.7 6.4 6.2 6.0 6.0 5.8 5.9 5.4 5.2 4.7 4.6 4.2 3.9 4.0 3.8 3.6 3.6 3.6 2019-01 2019-01 2019-03 2019-04 2019-05 2019-05 2019-06 2019-07 2019-08 2019-09 2019-10 2019-11 2019-12 2020-01 2020-02 2020-03 2020-04 2020-05 2020-06 2020-07 2020-08 2020-09 2020-10 2020-11 2020-12 2021-01 2021-02 2021-03 2021-04 2021-05 2021-06 2021-07 2021-08 2021-09 2021-10 2021-11 2021-12 2022-01 2022-02 2022-03 Unemployment Rate, % OHNWA uno VOS SERES N UNDAT