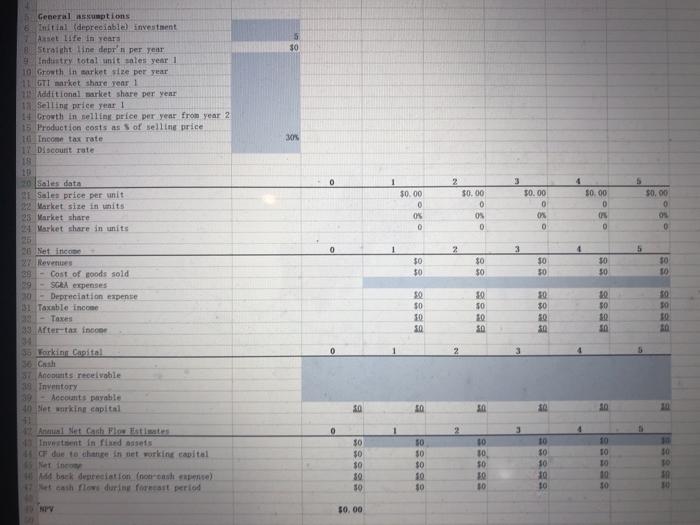
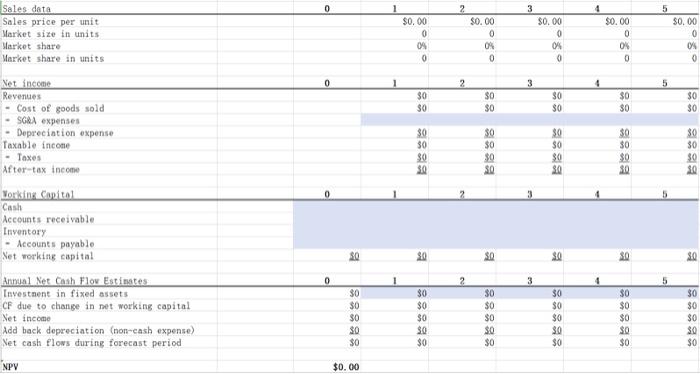
PestGo Ltd develops and sells pest management products and services to residential and commercial customers. The company recently spent $10 million on the research and development of a new product ("Secret X"), which is now ready to take to market. PestGo has asked you to undertake a financial analysis of this implementation stage of the project, which you will provide in the form of a spreadsheet and a memo to the CEO. Secret X is a new method for protecting the barriers of buildings from termites. It will cost more to produce and install than existing termite barriers on the market and the project's risk is thought to be significantly higher than PestGo's current operations. However, Secret X's benefit lies in being non- toxic, thus protecting soils, waterways and health, and for this reason the Board of Directors is very supportive of the project, given one of the key strategies of the company is to become more environmentally and socially responsible. They hope Secret X will become more popular than the toxic termite barriers that the company and its competitors currently sell. You have been advised to assess the project based on a 5 year life because after that technological improvements and new competitive products are likely to result in Secret X becoming obsolete. You have been given the following forecasts, all based on estimates internally generated by managers of relevant departments within PestGo. Tentative annual sales revenues of $20 million are expected for Secret X in its first year. These are expected to grow by 20% per year in each of years 2, 3 and 4. However, a drop-off in sales revenues of 30% is expected in year 5 as competitive products enter the market. Forecast cost of goods sold is 65% of sales revenues, while other operating expenses (excluding depreciation) directly related to the project are expected to be $4 million in the first year and increase by 2% per year (the consensus forecast inflation rate in the economy) thereafter. Interest expense related to the project is estimated to be $0.75 million per year, a cost already confirmed with the company's bankers. The project will need net working capital on hand equal to 25% of each upcoming year's sales revenue forecast. This estimate is based on historical customer and production information for very similar products and using existing suppliers whose contract arrangements are expected to continue. The Investment in working capital will be fully recovered by the end year 5. An upfront investment in non-specialised plant and equipment will be required for the project. Quotes already received suggest plant and equipment costs will total of $15 million. These costs will be depreciated to a zero book value using the prime cost method over the five-year life of the project. At the end of the project, the equipment will be sold for its estimated market scrap value at that time of $2 million. Project operations will be run out of a factory that PestGo already owns but currently rents to another company for $0.7 million per year, an amount that was likely to continue for the next five years. PestCo has a 7% weighted average cost of capital and a 30% income tax rate. For the purpose of this case analysis, all taxes are paid in the year of income to which they relate, the company will have taxable income from other projects and the company is not eligible for any special research and development tax treatment. Required: Prepare (1) a spreadsheet financial analysis of the proposed project and (2) a memo to PestCo's CEO that summarises your key results and provides recommendations on the project. Note carefully the following points: . . Analyse base case (expected) cash flows and potential uncertainty. For your base case analysis, calculate the five investment decision criteria listed in the relevant topic's Overview document. If you make any assumptions beyond those given in the case information, explain them. Recommendations should address the decision suggested by the base case, along with further follow up or other matters the company should consider prior to making a final decision. Indude an appendix to the memo that provides a readable screenshot(s) of your base case cash flows, the purpose of which is to allow the CEO to see line item detail without needing to spend time going to the spreadsheet itself. Within the memo body, you are advised to use tables and/or figures to assist decision makers quickly see main points and to visualise your analysis results but ensure the tables and figures are discussed or explained. . 30 General assumptions 6 in (depreciable investment et life in years Straticht line depr'n per year Industry total unit sales year 1 10 Growth in market size per year 11 GTI market share year 1 10. Additional market share per year 17 Selling price year 1 14 Growth in selling price per year from year 2 15 Production costs as Sor selling price Income tax rate 19 Discount rate 18 10 Sales data Sales price per unit 22 Market size in its 25 Market share Market share in units 26 Net incoe Revenise 30 Cost of woods sold 39 - SGRA expenses 30 - Depreciation expense 31 Taxable income Taxes 33. After tax incone 0 3 4 $0.00 SO. 00 2 $0.00 0 ON 0 $0.00 0 Bog $0.00 0 Ox 0 0 0 0 0 2 30 $0 30 30 30 50 BESS 88 SSS 10 0 30 30 10 SO 30 50 50 30 30 50 0 2 3 30 Forkin Capital 130 Cash Ants receivable 39 Inventory 39. Accounts payable 40 let working capital 11 17 Anaal Net Cash Flow states Investment in fied assets 41 F due to change in ot working capital 30 30 30 40 0 30 $0 $0 50 30 $0 10 30 50 10 30 10 10 10 10 10 88588 ESSE wback depreciation (not cas ) et cash flow during fast period SO $0 $0.00 0 4 5 SO,00 Sales data Sales price per unit Market size in units Slarket share Market share in units $0.00 0 OS 0 2 $0.00 0 0% 0 3 SO,00 0 OS 0 $0.00 0 0% 0 OS 0 0 2 3 4 5 $0 30 $0 SO 30 30 SO 30 $0 30 Net income Revenues - Cost of goods sold SGRA expenses - Depreciation expense Taxable income - Taxes After-tax income $0 $0 30 30 30 30 30 30 SO 30 $0 $0 30 30 30 $0 30 $0 0 3 5 30 30 SO 30 30 $0 Working Capital Cash Accounts receivable Inventory - Accounts payable Net working capital Annual Net Cash Flow Estimates Investment in fixed assets CF due to change in net working capital Net income Add back depreciation (non-cash expense) Net cash flows during forecast period 0 2 3 5 $0 $0 $0 SO 30 $0 $0 30 $0 $0 88888 30 $0 $0 30 $0 $0 $0 $0 SO $0 30 $0 $0 30 $0 NPV $0.00
