Answered step by step
Verified Expert Solution
Question
1 Approved Answer
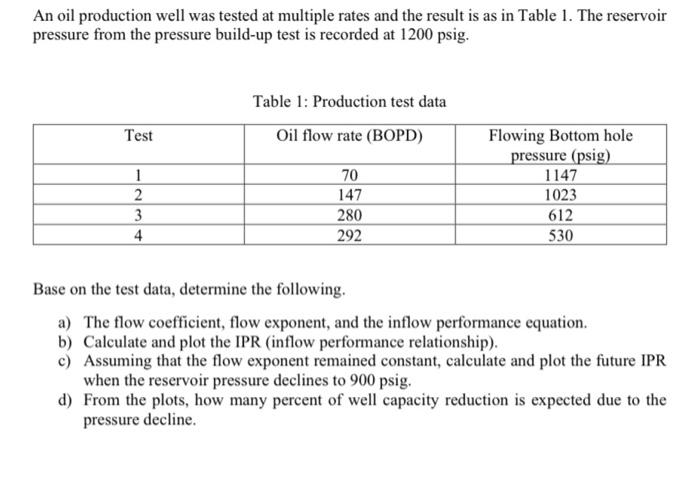
PETROLEUM PRODUCTION ENGINEERING An oil production well was tested at multiple rates and the result is as in Table 1. The reservoir pressure from the
PETROLEUM PRODUCTION ENGINEERING 
An oil production well was tested at multiple rates and the result is as in Table 1. The reservoir pressure from the pressure build-up test is recorded at 1200 psig. Table 1: Production test data Test Oil flow rate (BOPD) Flowing Bottom hole pressure (psig) 1147 1 70 2 147 1023 3 280 612 4 292 530 Base on the test data, determine the following. a) The flow coefficient, flow exponent, and the inflow performance equation. b) Calculate and plot the IPR (inflow performance relationship). c) Assuming that the flow exponent remained constant, calculate and plot the future IPR when the reservoir pressure declines to 900 psig. d) From the plots, how many percent of well capacity reduction is expected due to the pressure decline 
Step by Step Solution
There are 3 Steps involved in it
Step: 1

Get Instant Access to Expert-Tailored Solutions
See step-by-step solutions with expert insights and AI powered tools for academic success
Step: 2

Step: 3

Ace Your Homework with AI
Get the answers you need in no time with our AI-driven, step-by-step assistance
Get Started


