Photo 1
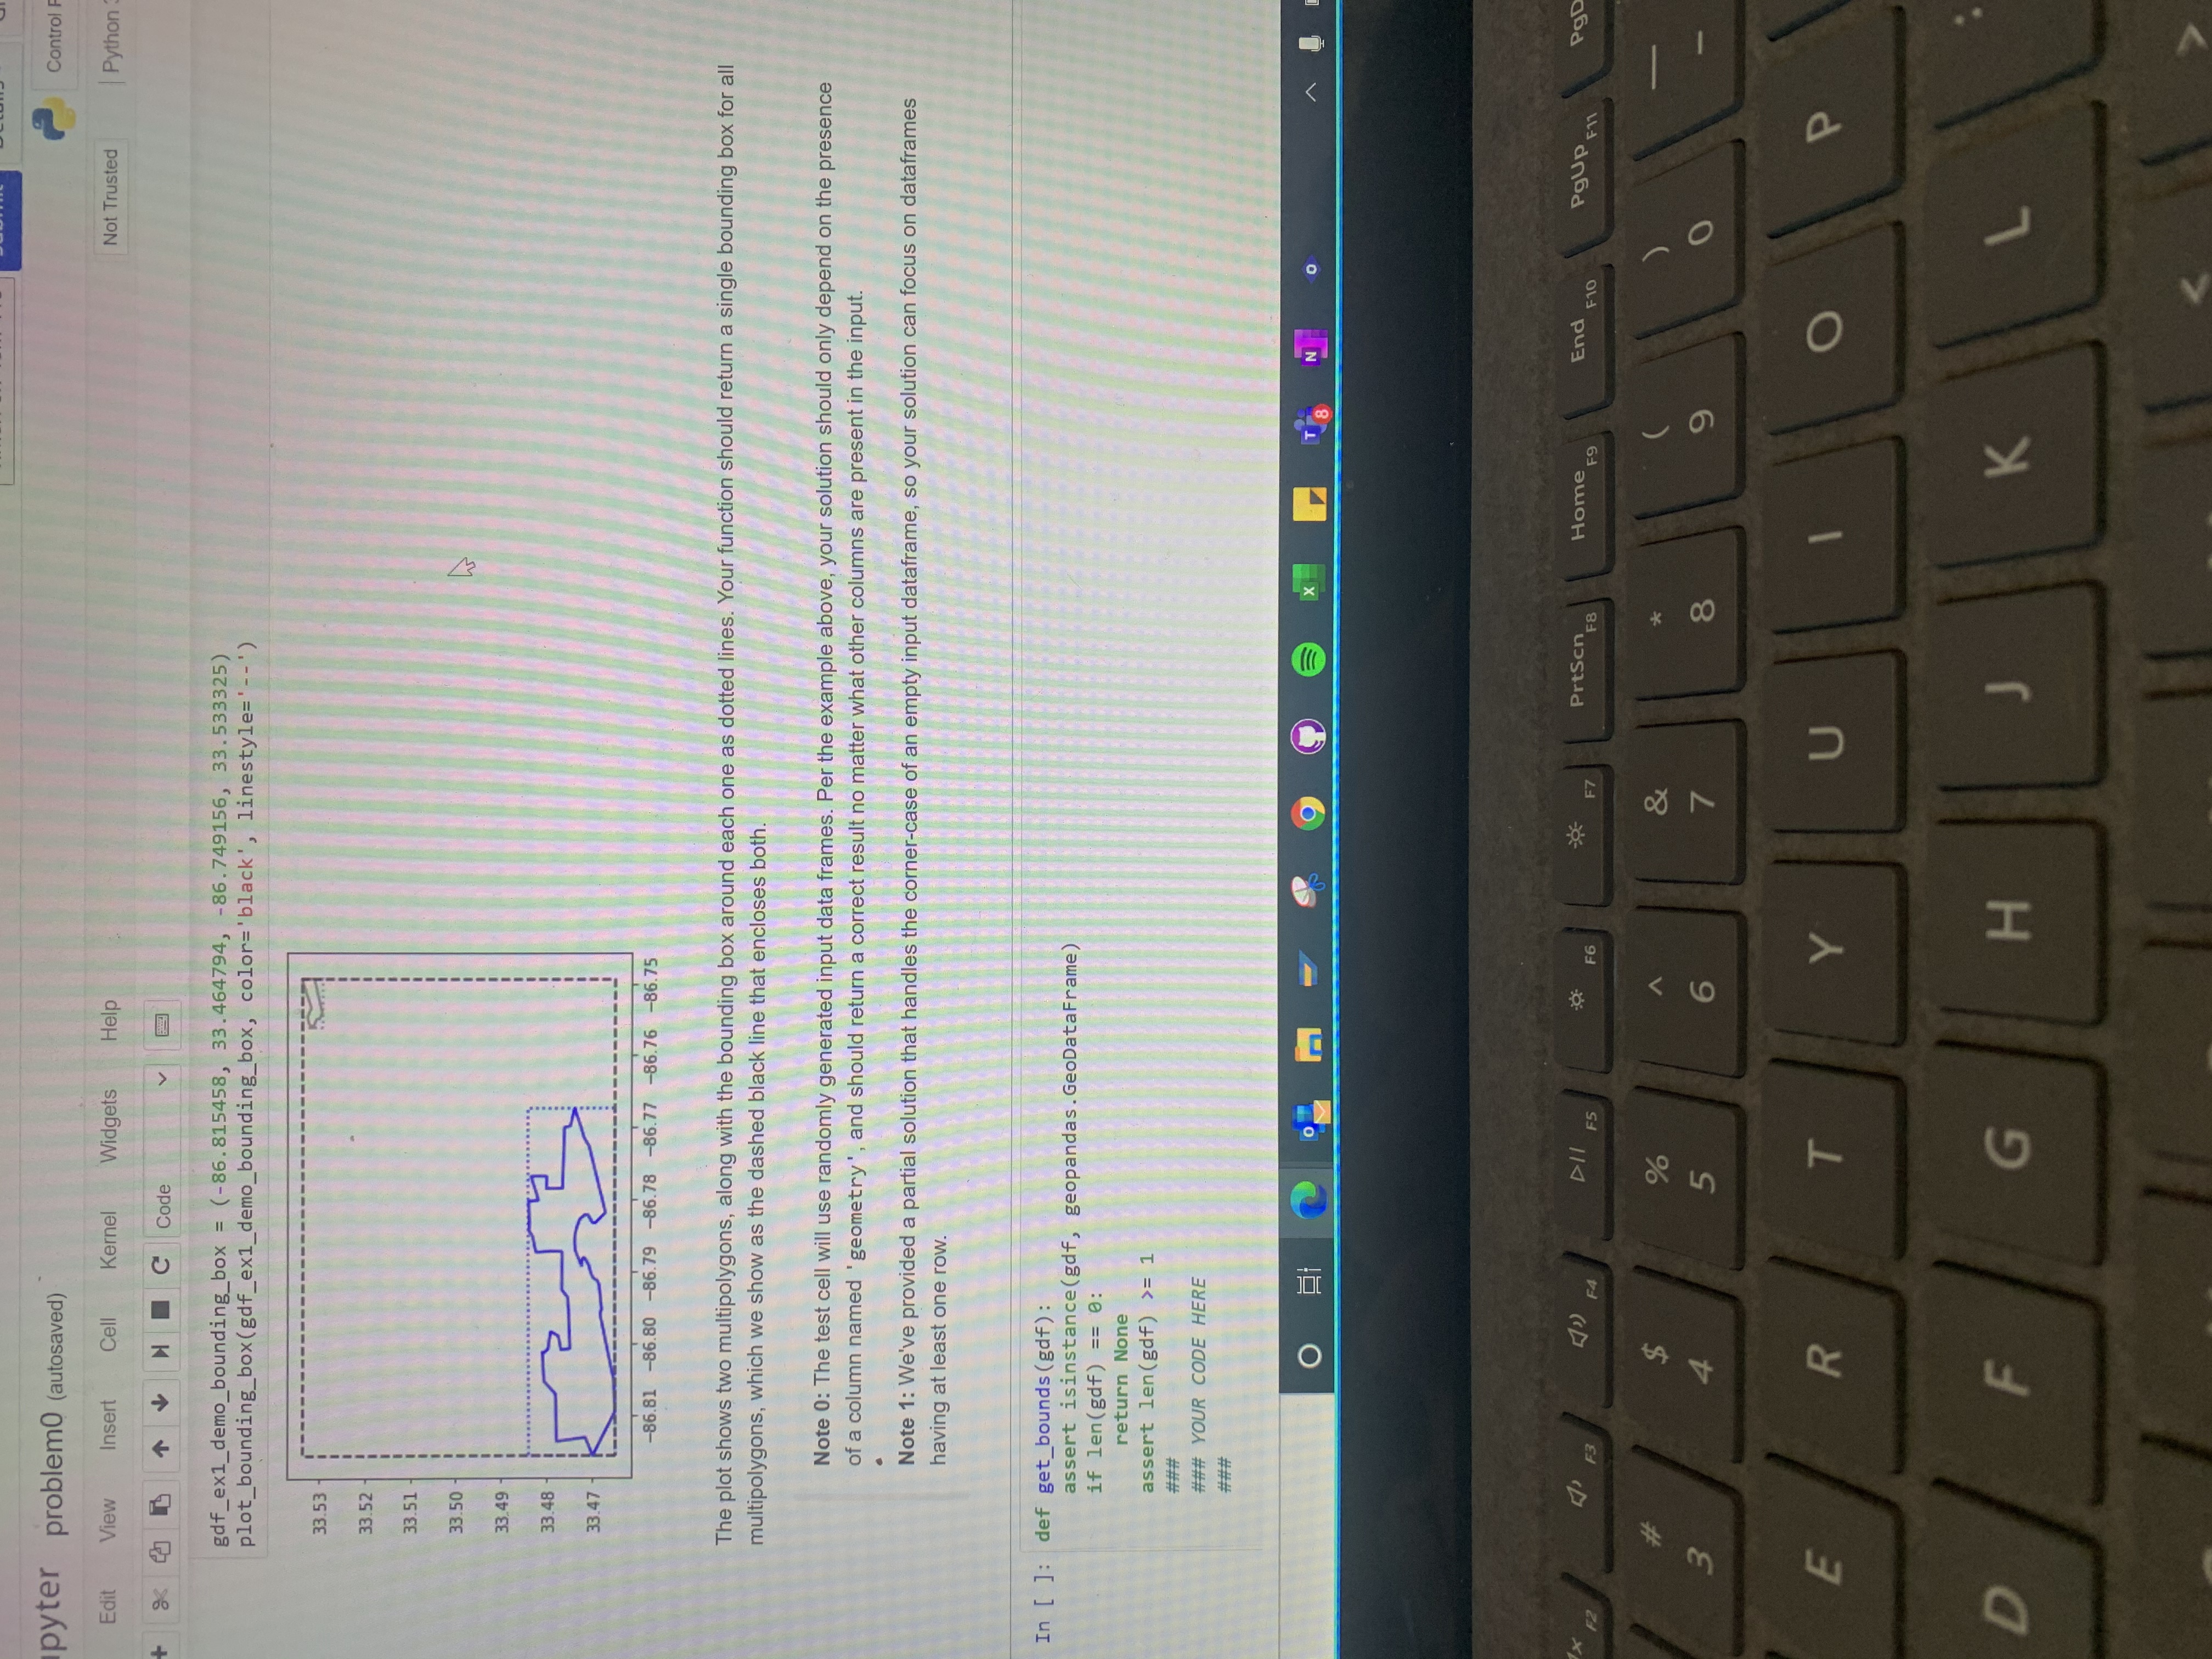
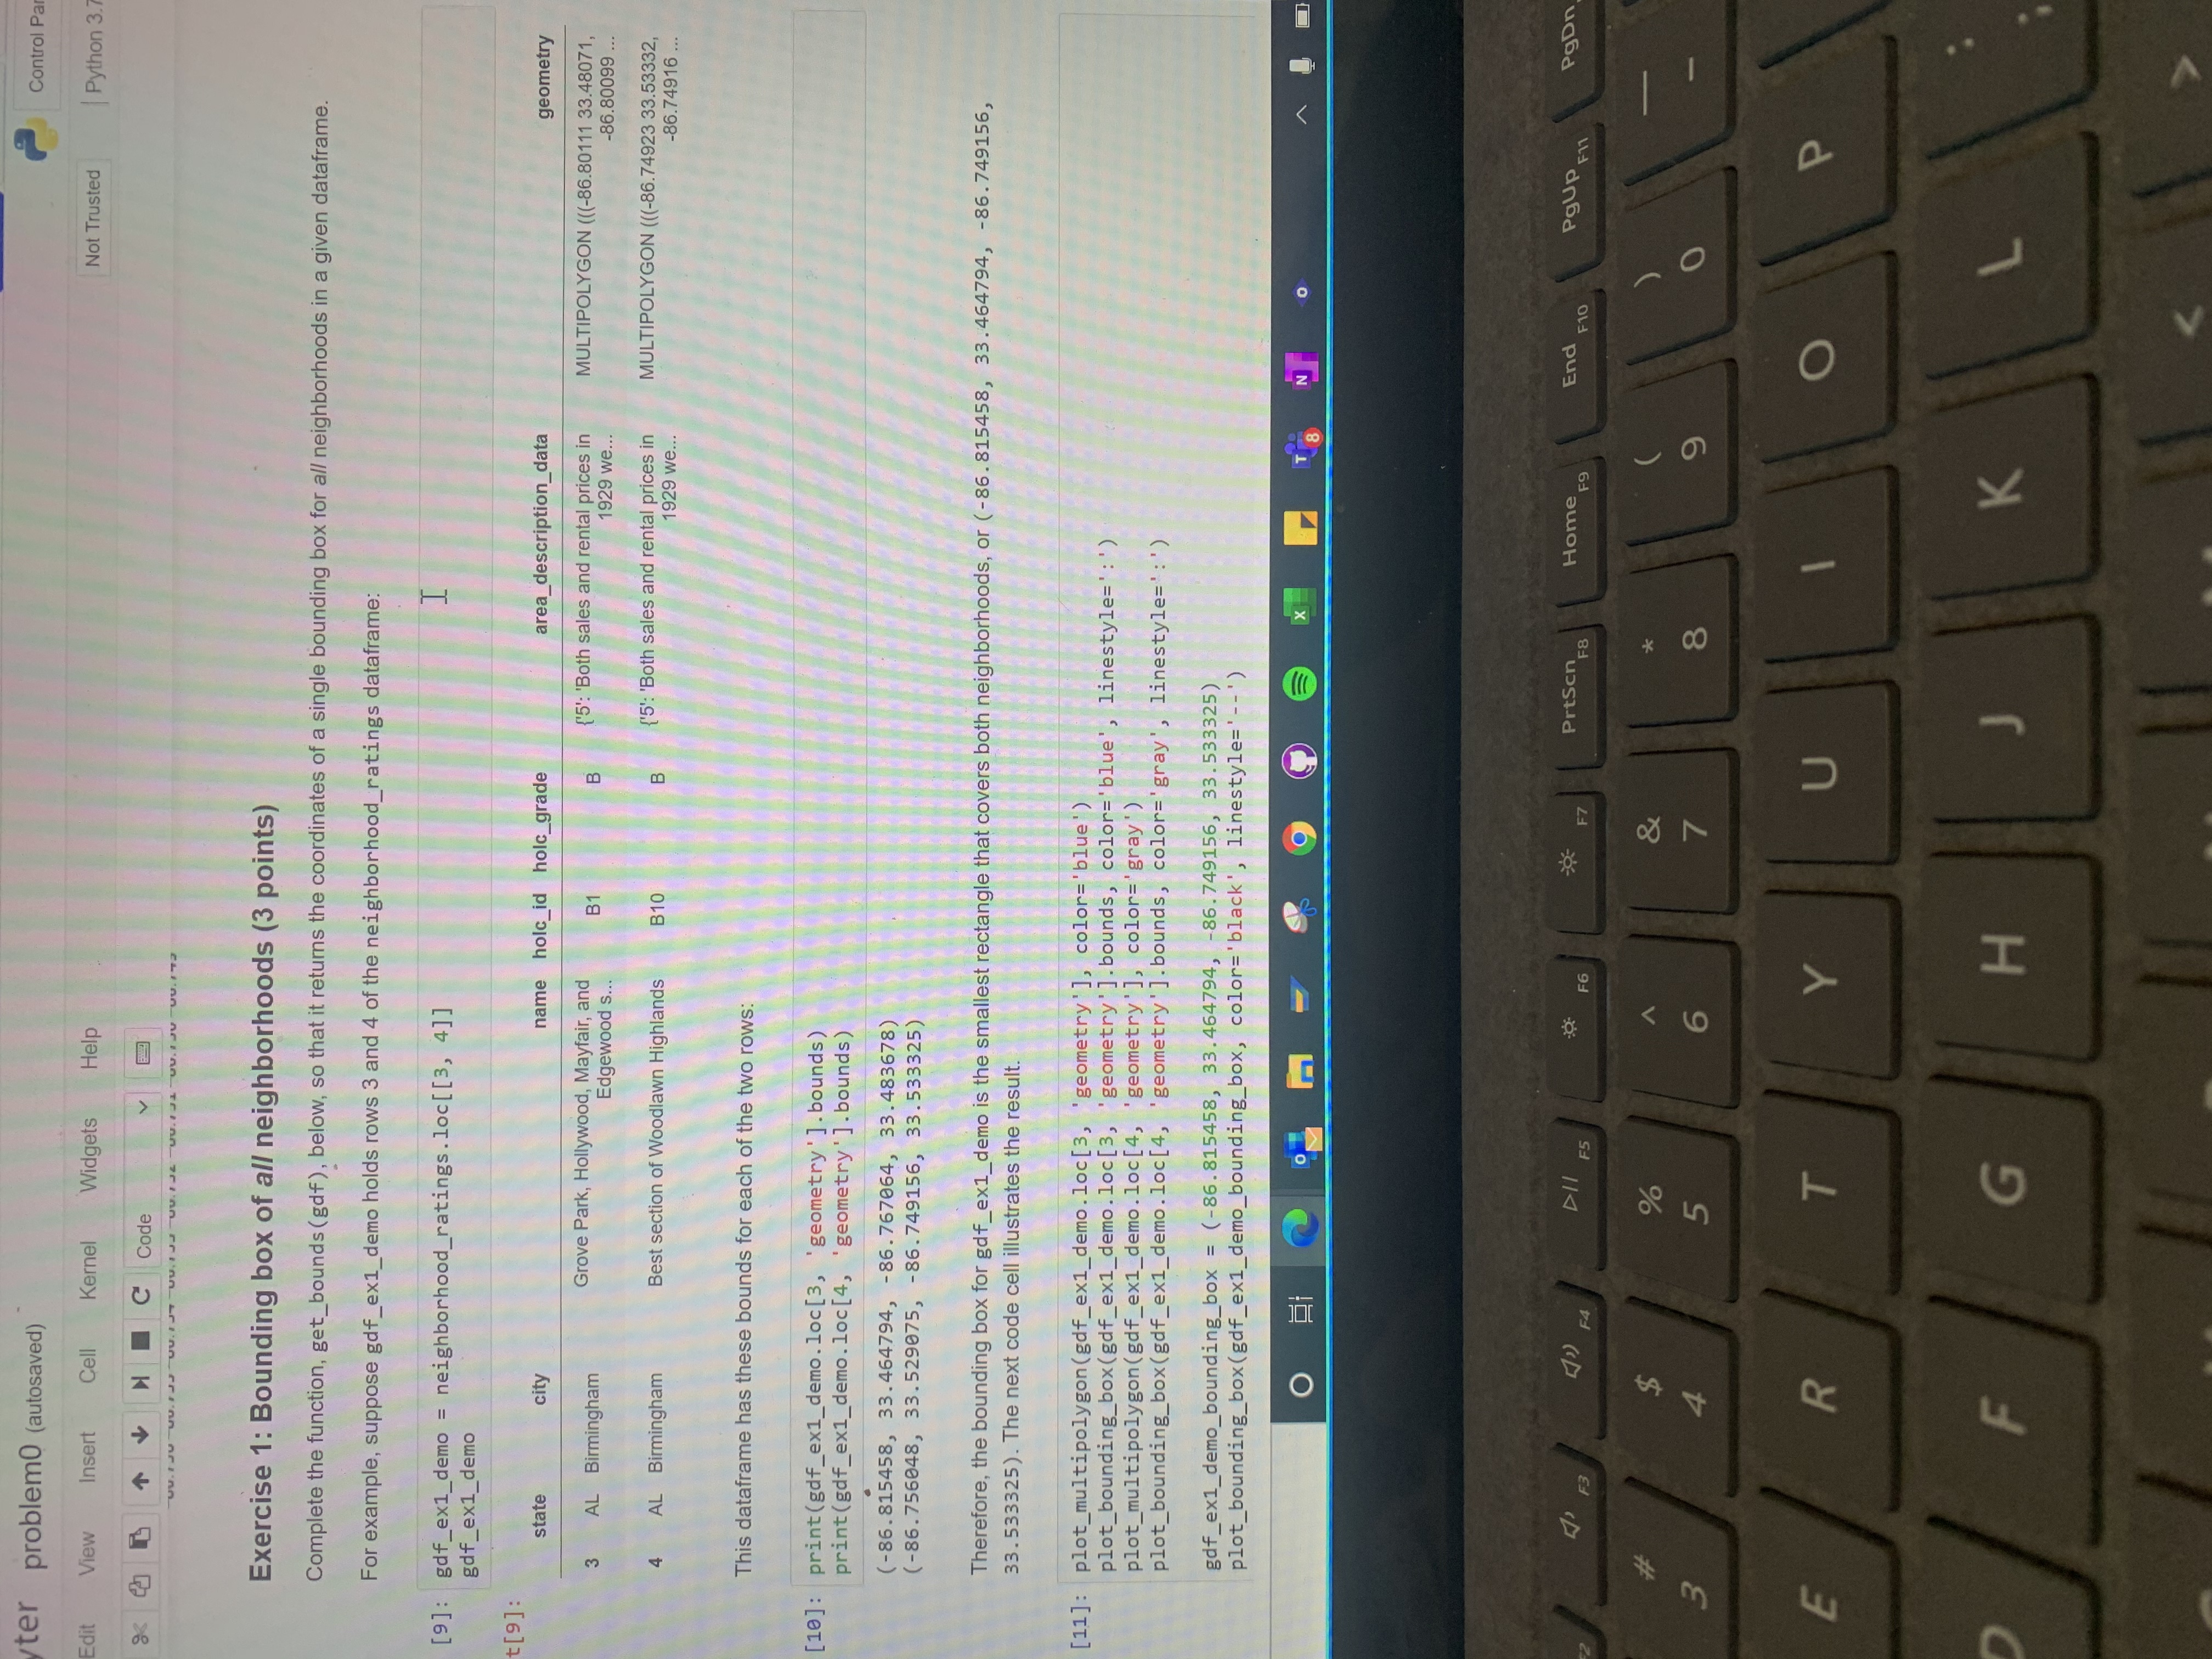
pyter problem0 (autosaved) Control Edit View Insert Cell Kernel Widgets Help Not Trusted Python - H C Code gdf_ex1_demo_bounding_box = (-86. 815458, 33. 464794, -86. 749156, 33. 533325) plot_bounding_box(gaf_ex1_demo_bounding_box, color= 'black', linestyle=' -- ') 33.53 33.52 33.51 33.50 33.49 33.48 33.47 -86.81 -86.80 -86.79 -86.78 -86.77 -86.76 -86.75 The plot shows two multipolygons, along with the bounding box around each one as dotted lines. Your function should return a single bounding box for all multipolygons, which we show as the dashed black line that encloses both. Note 0: The test cell will use randomly generated input data frames. Per the example above, your solution should only depend on the presence of a column named ' geometry ', and should return a correct result no matter what other columns are present in the input. Note 1: We've provided a partial solution that handles the corner-case of an empty input dataframe, so your solution can focus on dataframes having at least one row. In [ ]: def get_bounds (gaf) : assert isinstance(gdf, geopandas . GeoDataFrame) if len(gdf == 0: return None assert len (gdf >= 1 ### ### YOUR CODE HERE ### O - 97 EX T 8 N 0 DI F5 F7 PrtSch F8 Home F9 End F10 PgUP F11 Pg F3 F4 F6 $ 3 4 5 7 E R T Y U O P D F G H Kter problem0 (autosaved) Control Pa Edit View Insert Cell Kernel Widgets Help Not Trusted |Python 3. 1 - H IC Code Trinn- sinn Finn Exercise 1: Bounding box of all neighborhoods (3 points) Complete the function, get_bounds (gaf ), below, so that it returns the coordinates of a single bounding box for all neighborhoods in a given dataframe. For example, suppose gaf_ex1_demo holds rows 3 and 4 of the neighborhood_ratings dataframe: [9]: gdfex1_demo = neighborhood_ratings . loc[ [3, 4]] I gdf_ex1_demo [9] state city name holc_id holc_grade area_description_data geometry 3 AL Birmingham Grove Park, Hollywood, Mayfair, and MULTIPOLYGON (((-86.80111 33.48071, B1 B 5': 'Both sales and rental prices in Edgewood s... 1929 we ... -86.80099 .. MULTIPOLYGON (((-86.74923 33.53332, AL Birmingham Best section of Woodlawn Highlands B10 B '5': 'Both sales and rental prices in 1929 we... -86.74916 . This dataframe has these bounds for each of the two rows: [10]: print(gaf_ex1_demo . loc[3, 'geometry' ]. bounds) print (gdf _ex1_demo . loc [4, 'geometry ' ]. bounds) (-86. 815458, 33. 464794, -86. 767064, 33.483678 (-86. 756048, 33.529075, -86. 749156, 33.533325) Therefore, the bounding box for gaf_ex1_demo is the smallest rectangle that covers both neighborhoods, or (-86 . 815458, 33. 464794, -86.749156, 33. 533325). The next code cell illustrates the result. [11]: plot_multipolygon(gaf_ex1_demo . loc [3, 'geometry' ], color= 'blue') plot_bounding_box(gaf_ex1_demo . loc[3, 'geometry' ]. bounds, color='blue', linestyle=': ') plot_multipolygon(gaf_ex1_demo . loc[4, 'geometry' ], color='gray') plot_bounding_box(gaf_ex1_demo . loc[4, 'geometry' ]. bounds, color= 'gray', linestyle=': ') gdf_ex1_demo_bounding_box = (-86. 815458, 33. 464794, -86. 749156, 33. 533325) plot_bounding_box(gdfex1_demo_bounding_box, color= 'black', linestyle=' --' ) O x 1 8 N PrtSen F8 End F10 PgUP F11 PgDr F3 F4 DI F5 F6 F7 -F9 % 4 5 O E R T Y U O P F G H KTimer: 3h 49m 2s Submit Details Grades problem0 (autosaved) Control Panel View Insert Cell Kernel Widgets Help Not Trusted |Python 3.7 - H IC Code -84.45 -84.40 -84.35 -84.30 -84.25 longitude Bounding boxes Recall that a geopandas dataframe includes a ' geometry ' column, which defines the geographic shape of each neighborhood using special multipolygon objects. To simplify some geometric calculations, a useful operation is to determine a multipolygon's bounding box, which is the smallest rectangle that encloses it. Getting a bounding box is easy! For example, recall the neighborhood in row 4 of the neighborhood_ratings geopandas dataframe: g4_example = neighborhood_ratings . loc[4, ' geometry' ] print("* Type of g4_example":", type(g4_example) ) print("\ * Contents of g4_example" :", g4_example) print ("\ * A quick visual preview: ") display (g4_example) * Type of g4_example :
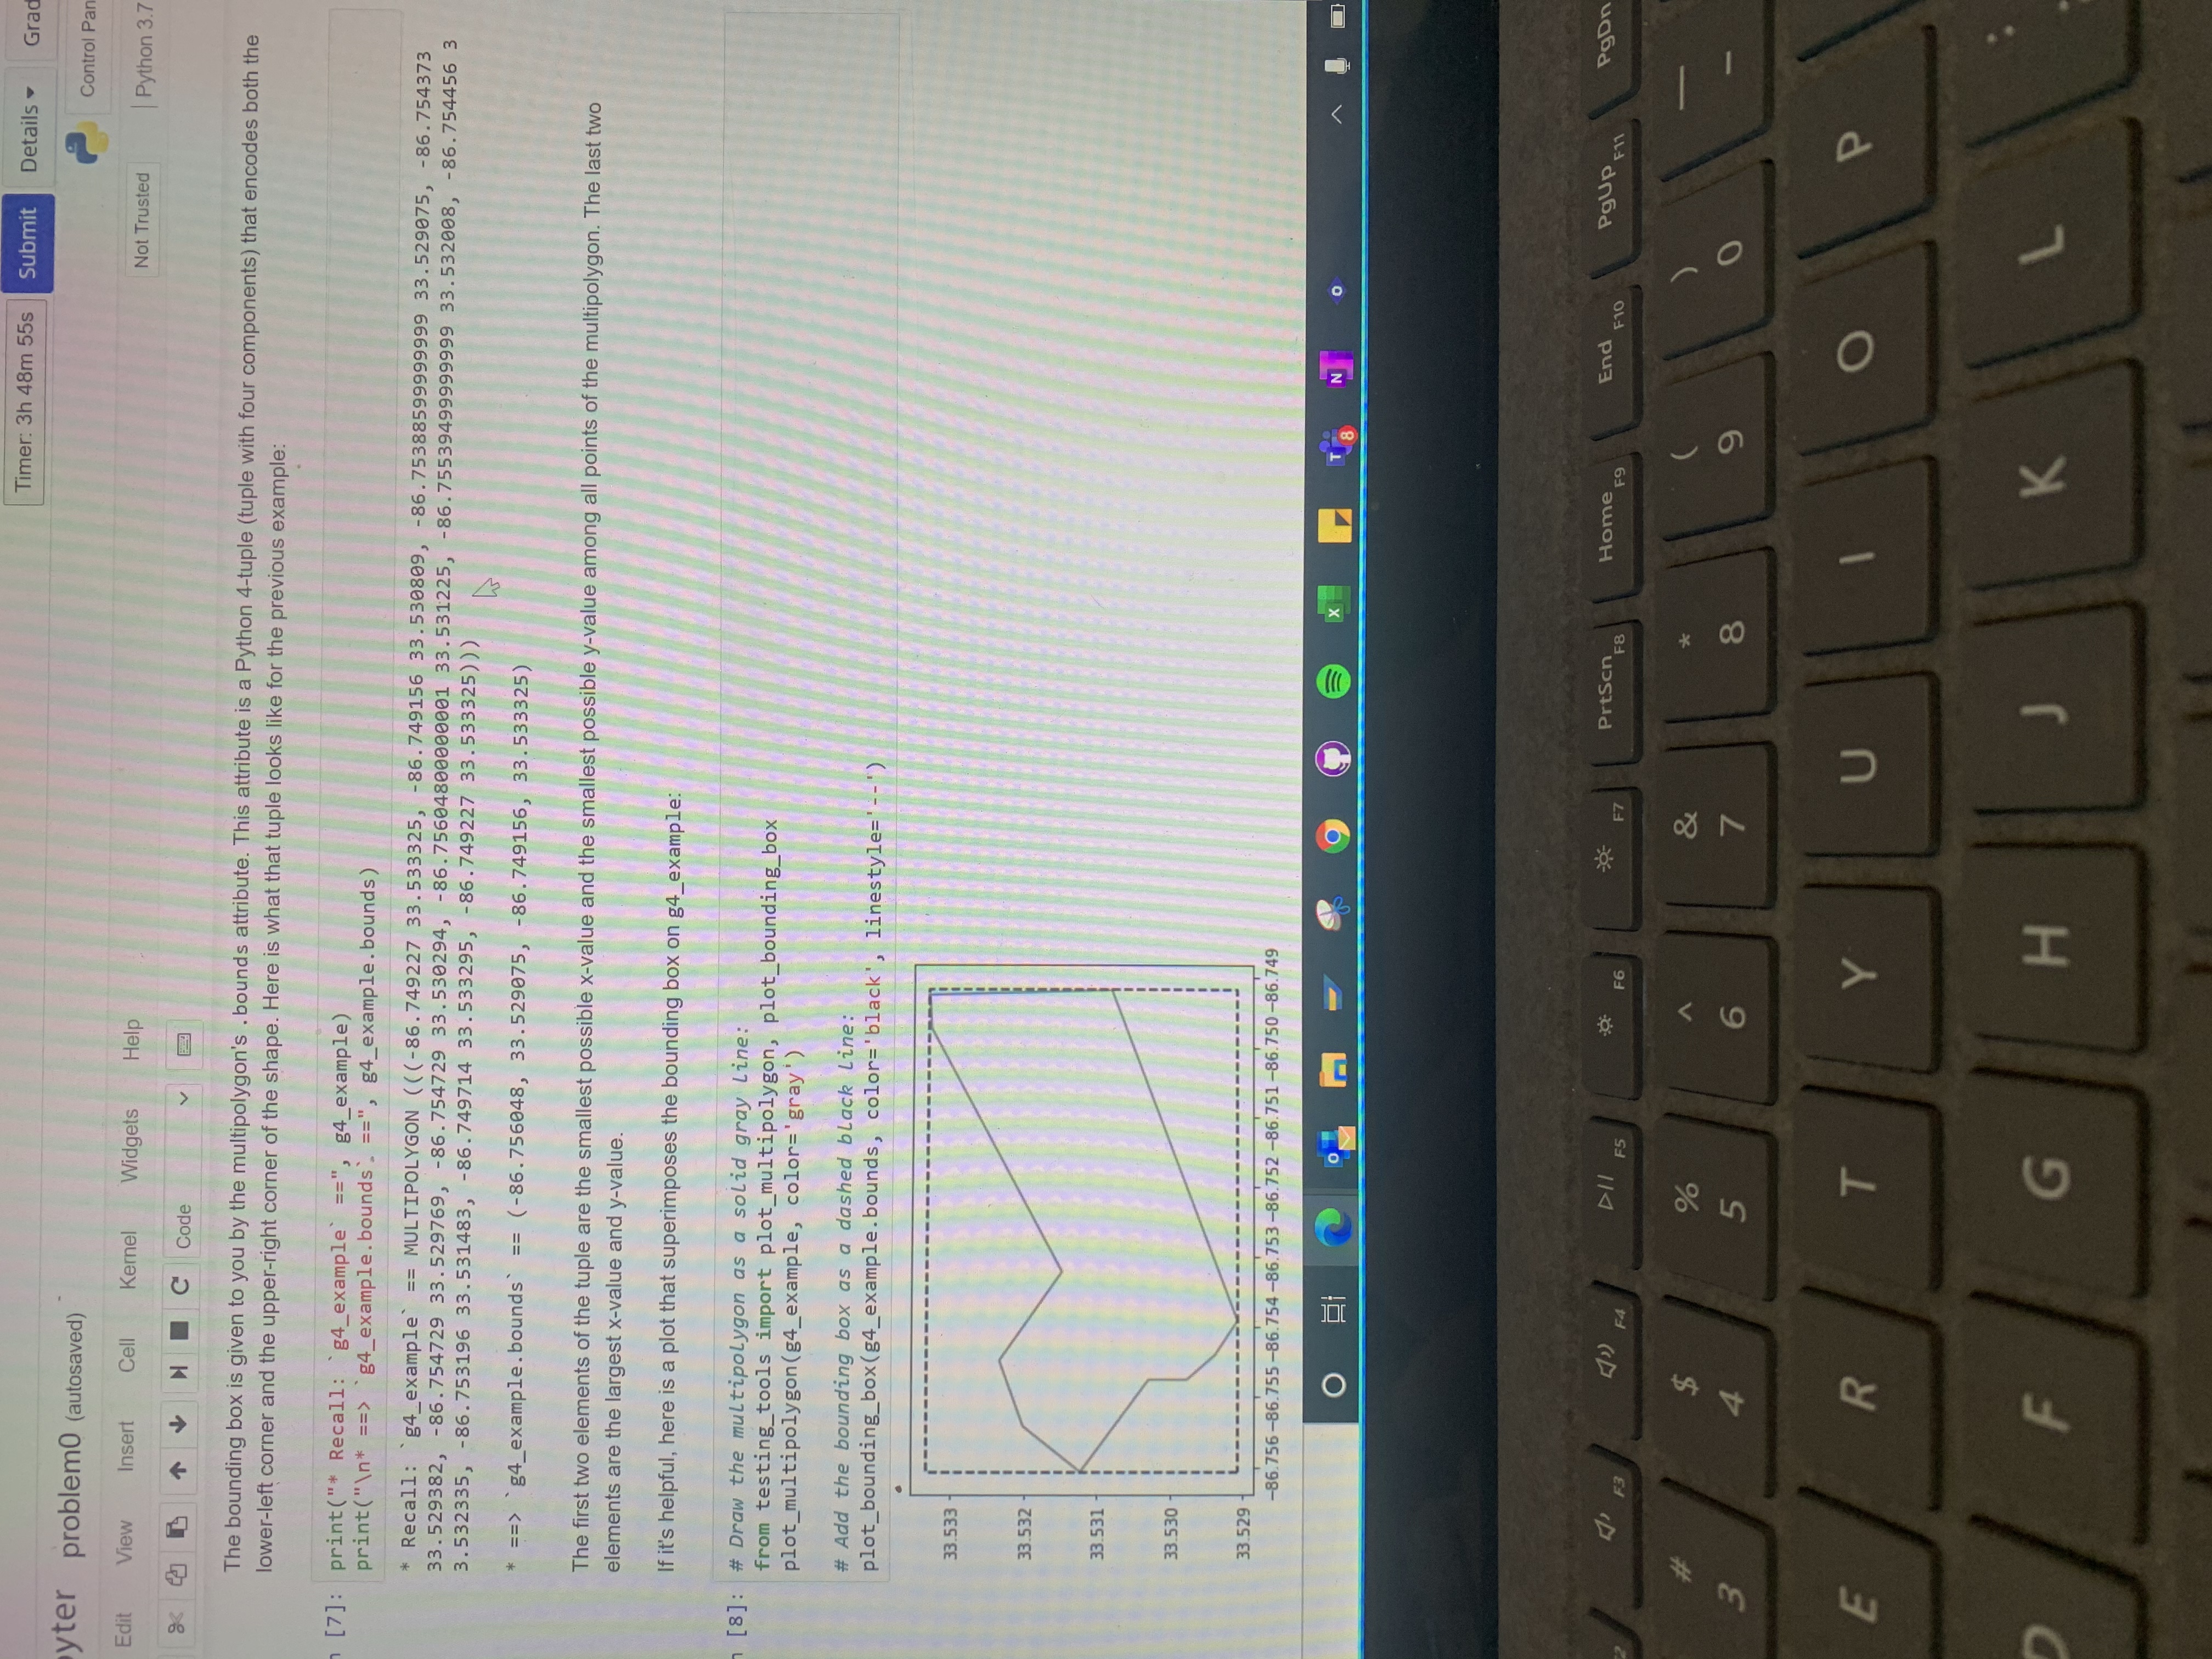
* Contents of `g4_example : MULTIPOLYGON (((-86. 749227 33 . 533325, -86. 749156 33. 530809, -86. 75388599999999 33.529075, -86.75437 3 33. 529382, -86. 754729 33.529769, -86. 754729 33. 530294, -86. 75604800000001 33. 531225, -86. 75539499999999 33.532008, -86.754456 33. 532335, -86. 753196 33. 531483, -86. 749714 33.533295, -86. 749227 33 .533325) ) ) * A quick visual preview: The bounding box is given to you by the multipolygon's . bounds attribute. This attribute is a Python 4-tuple (tuple with four components) that encodes both the lower-left corner and the upper-right corner of the shape. Here is what that tuple looks like for the previous example: print("* Recall: g4_example' ==", g4_example) print ("\ * ==> `g4_example. bounds ' ==", g4_example. bounds) O O 9 X T 8 N End PODA DI F5 PrtSen PgUP F11 F3 F4 F6 F7 F9 % O 4 5 T Y U O P R F G H K LTimer: 3h 48m 55s Submit Details Grad yter problem0 (autosaved) Control Par Edit View Insert Cell Kernel Widgets Help Not Trusted |Python 3 . 8 4 5 + + H C Code The bounding box is given to you by the multipolygon's . bounds attribute. This attribute is a Python 4-tuple (tuple with four components) that encodes both the lower-left corner and the upper-right corner of the shape. Here is what that tuple looks like for the previous example: : print("* Recall: g4_example' ==", g4_example) print("\ * ==> 'g4_example. bounds . ==", g4_example. bounds) * Recall: g4_example == MULTIPOLYGON (((-86. 749227 33. 533325, -86. 749156 33. 530809, - 86. 75388599999999 33.529075, -86.754373 33. 529382, -86. 754729 33. 529769, -86. 754729 33. 530294, -86. 75604800000001 33.531225, -86. 75539499999999 33.532008, -86. 754456 3 3. 532335, -86. 753196 33. 531483, -86. 749714 33. 533295, -86. 749227 33 . 533325) ) ) * ==> g4_example . bounds == (-86. 756048, 33 . 529075, -86. 749156, 33. 533325) The first two elements of the tuple are the smallest possible x-value and the smallest possible y-value among all points of the multipolygon. The last two elements are the largest x-value and y-value. If it's helpful, here is a plot that superimposes the bounding box on g4_example: [8]: # Draw the multipolygon as a solid gray line: from testing_tools import plot_multipolygon, plot_bounding_box plot_multipolygon(g4_example, color='gray') # Add the bounding box as a dashed black Line: plot_bounding_box(g4_example. bounds, color='black', linestyle=' 33.533 33.532 33 531 33.530 33.529 -86.756-86.755-86.754-86.753-86.752 -86.751 -86.750-86.749 O PrtSon Home F9 End F10 PgUP F11 PgD 4' F3 F4 DI F5 F6 F7 % 4 5 6 7 T Y U O P E R F G H K