(photo 1-2)
Robinson Crusoe Production Possibility Curve
Robinson Crusoe lives alone on an island.He has some resources at his disposal:
1.Land:Some of the land is rocky and better suited for raising sheep.Other parts of the land are better suited for growing wheat.
2.Sheep
3.10 hours of daylight for working
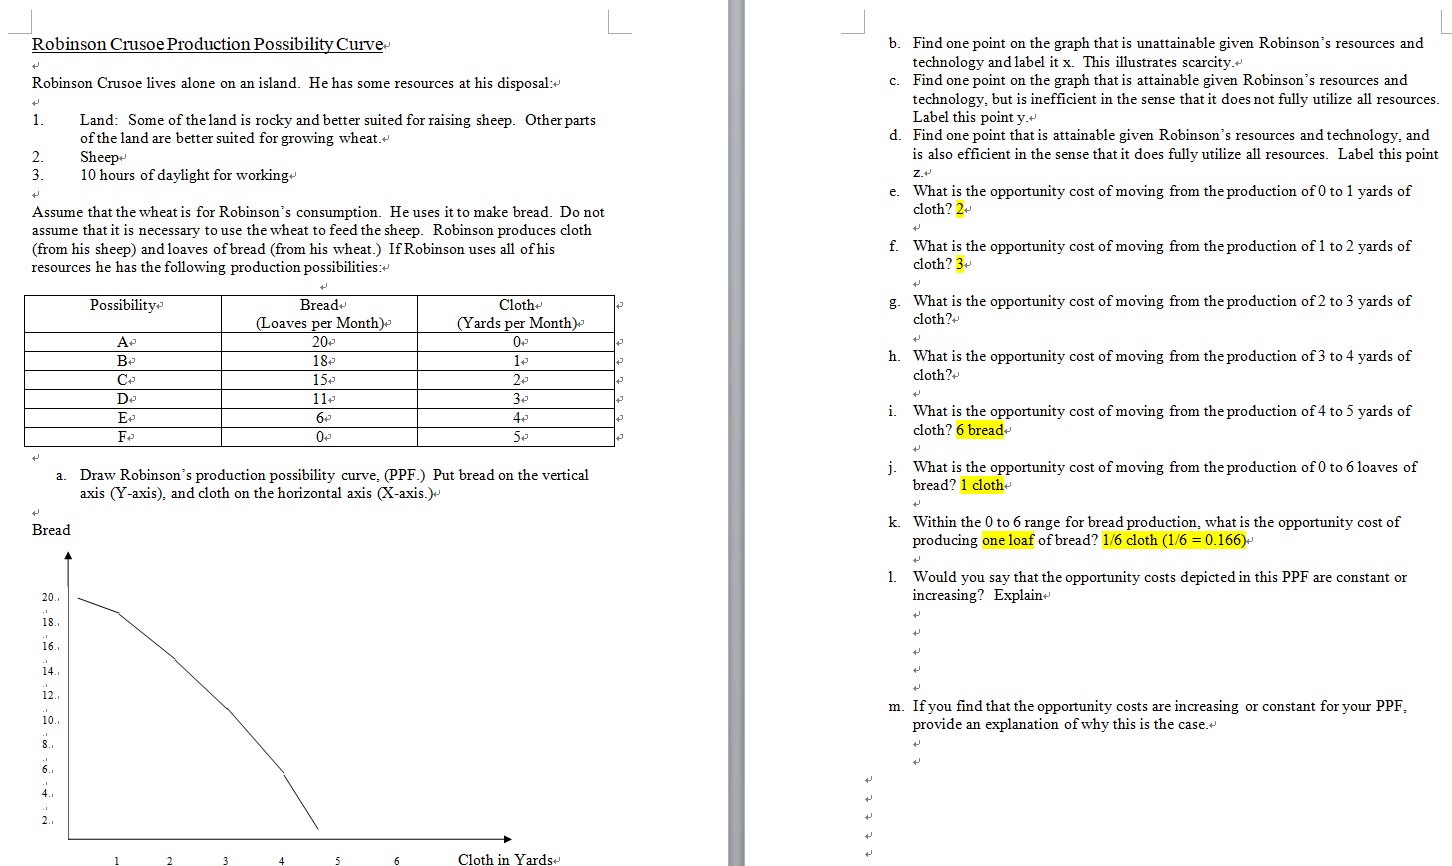
Assume that the wheat is for Robinson's consumption.He uses it to make bread.Do not assume that it is necessary to use the wheat to feed the sheep.Robinson produces cloth (from his sheep) and loaves of bread (from his wheat.)If Robinson uses all of his resources he has the following production possibilities:
b. Find one point on the graph that is unattainable given Robinson's resources and technology and label it x.This illustrates scarcity.
c. Find one point on the graph that is attainable given Robinson's resources and technology, but is inefficient in the sense that it does not fully utilize all resources.Label this point y.
d. Find one point that is attainable given Robinson's resources and technology, and is also efficient in the sense that it does fully utilize all resources.Label this point z.
e. What is the opportunity cost of moving from the production of 0 to 1 yards of cloth? 2
f. What is the opportunity cost of moving from the production of 1 to 2 yards of cloth? 3
g. What is the opportunity cost of moving from the production of 2 to 3 yards of cloth?
h. What is the opportunity cost of moving from the production of 3 to 4 yards of cloth?
i. What is the opportunity cost of moving from the production of 4 to 5 yards of cloth? 6 bread
j.What is the opportunity cost of moving from the production of 0 to 6 loaves of bread? 1 cloth
k. Within the 0 to 6 range for bread production, what is the opportunity cost of producing one loaf of bread? 1/6 cloth (1/6 = 0.166)
l. Would you say that the opportunity costs depicted in this PPF are constant or increasing?Explain
m.if you find that the opportunity costs are increasing or constant for your PPF, provide an explanation of why this is the case.
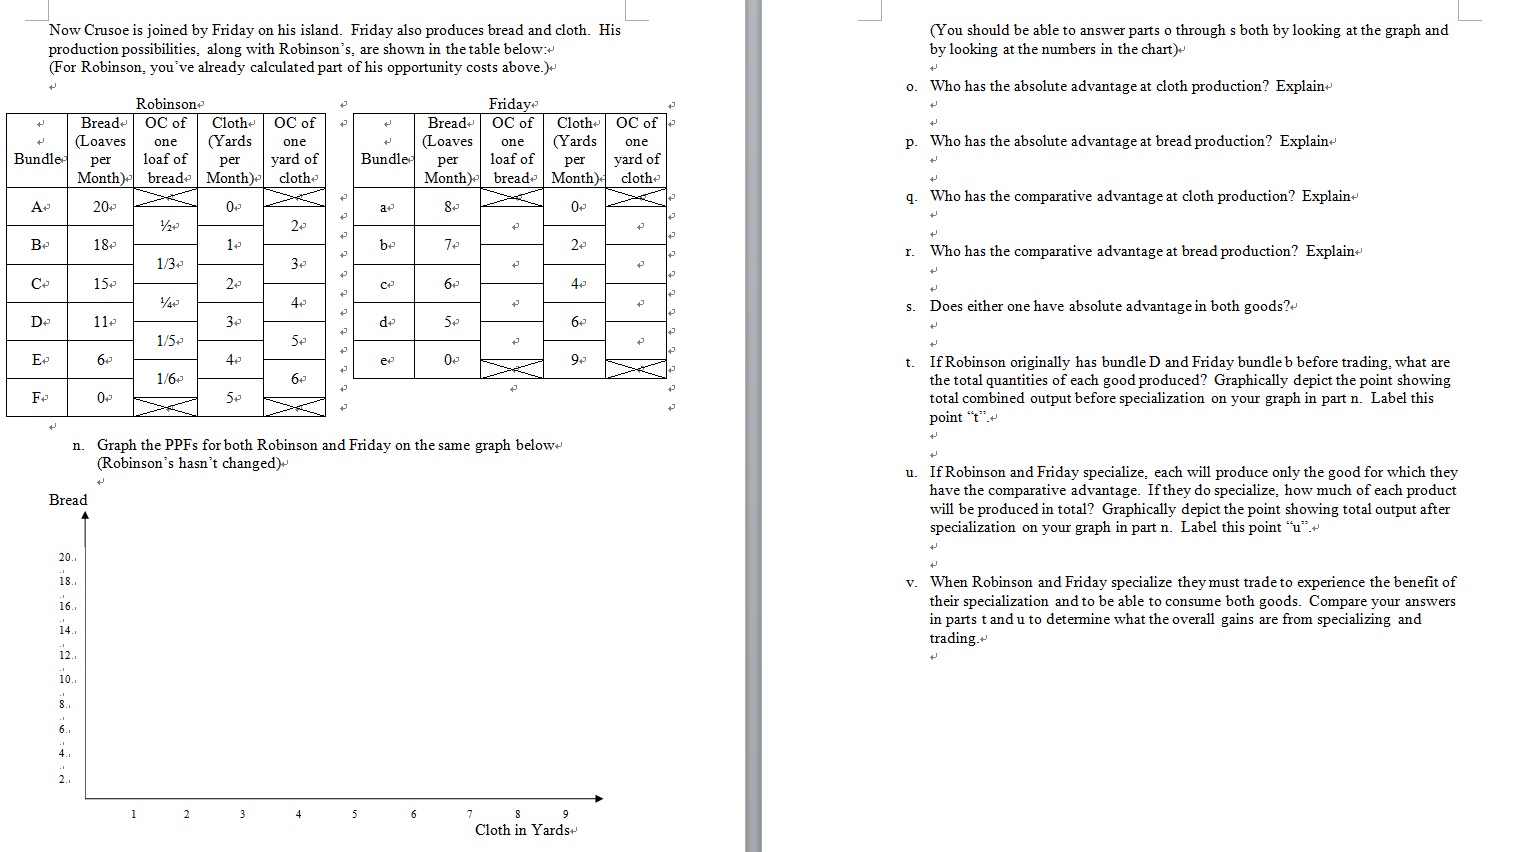
(Photo 3-4)
Robinson Crusoe Production Possibility Curve- b. Find one point on the graph that is unattainable given Robinson's resources and technology and label it x. This illustrates scarcity.+ Robinson Crusoe lives alone on an island. He has some resources at his disposal:+ c. Find one point on the graph that is attainable given Robinson's resources and technology, but is inefficient in the sense that it does not fully utilize all resources. Land: Some of the land is rocky and better suited for raising sheep. Other parts Label this point y.+ of the land are better suited for growing wheat.+ d. Find one point that is attainable given Robinson's resources and technology, and WN Sheep+ is also efficient in the sense that it does fully utilize all resources. Label this point 10 hours of daylight for working+ Z.+ e. What is the opportunity cost of moving from the production of 0 to 1 yards of Assume that the wheat is for Robinson's consumption. He uses it to make bread. Do not cloth? 2+ assume that it is necessary to use the wheat to feed the sheep. Robinson produces cloth (from his sheep) and loaves of bread (from his wheat.) If Robinson uses all of his f. What is the opportunity cost of moving from the production of 1 to 2 yards of resources he has the following production possibilities:+ cloth? 3+ Possibility+ Bread+ Cloth+ g- What is the opportunity cost of moving from the production of 2 to 3 yards of Loaves per Month) (Yards per Month) cloth?+ 20+ 0+ + 18+ 1+ h. What is the opportunity cost of moving from the production of 3 to 4 yards of Co 2+ cloth?+ 1 1+ 40 i. What is the opportunity cost of moving from the production of 4 to 5 yards of cloth? 6 bread+ a. Draw Robinson's production possibility curve, (PPF.) Put bread on the vertical j. What is the opportunity cost of moving from the production of 0 to 6 loaves of axis (Y-axis), and cloth on the horizontal axis (X-axis.)~ bread? 1 cloth+ Bread . Within the 0 to 6 range for bread production, what is the opportunity cost of producing one loaf of bread? 1/6 cloth (1/6 = 0.166)+ 1. Would you say that the opportunity costs depicted in this PPF are constant or 20. increasing? Explain+ 18 . + 16. 14 . t 12 . 10 . m. If you find that the opportunity costs are increasing or constant for your PPF. provide an explanation of why this is the case.+ 8 . . 1oth ttttJ L Now Crusoe is joined by Friday on his island, Friday also produces bread and cloth, His production possibilities: along with Robinson's, are shown in the table below: (For Robinson, you've already calculated part of his opportunity costs above) .1 Robinan .1 Friday Bread OCof Cloth:J 0Cof .1 Bread 0C of Cloth OCof {Loaves one {Yards one (Loaves one (Yards one Bundlel per loaf of per yard of Bundle:J per loaf of per yard of Month) bread Month) 1116111.: Month) 1116311.: M61101). 1116111.: A. 20., E 0., K j a. 3.: Z 0., Z '25 2 .= .= B 18 1 : b 7 2.: 1/3 3.: .= .= C 15.: 2.: : m: 6.: 4.: 1/10 4.: a .: D 11.: 3.: : 11.: 5.: 6.: E1 6\" 1150 4'; 50 .1 w 0.1 a 9., 1/6 6.: : p E E F 0 5.: Y .1 n. Graph the PPFs for both Robinson and Friday on the same gaph below (Robinson's hasn't changed) .1 Bread 20. 111. 16. 1'4. 121 in. l 2 3 4 5 6 1 l 9 Cloth in Yards 1. cunnnnnntttt {You should be able to answer parts o through s both by looking at the graph and by looking at the numbers in the chart) .1 . Who has the absolute advantage at cloth production? Explain .1 .1 . Who has the absolute advantage at bread pro duction? Explain .1 .1 . Who has the comparative advantage at cloth production? Explain .1 .1 Who has the comparative advantage at bread production? Explain .1 .1 Does either one have absolute advantage in both goods? .1 .1 IfRobinson originally has bundleD and Friday bundleb before trading, what are the total quantities of each good produced? Graphically depict the point showing total combined output before specialization on your graph in part In, Label this point t .1 .1 , If Robinson and Friday specialize, each will produce only the good for which they have the comparative advantage. If they do specialize, how much of each product will be produced in total? Graphically depict the point showing total output after specialization on your graph in part n, Label this point \"u", ,1 .1 , When Robinson and Friday specialize they must trade to experience the benet of their specialization and to be able to consume both goods, Compare your answers inparts t andu to determine what the overall gains are from specializing and trading. .1