Answered step by step
Verified Expert Solution
Question
1 Approved Answer
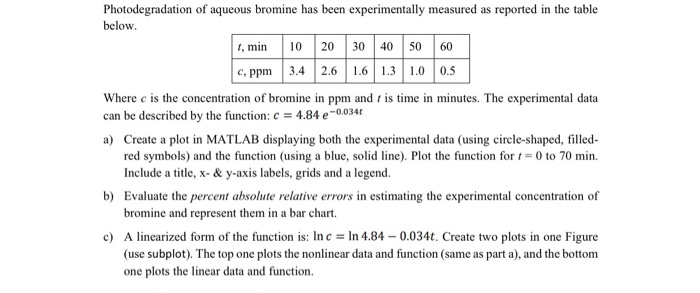
Photodegradation of aqueous bromine has been experimentally measured as reported in the table below. 1, min 10 20 30 40 50 60 c, ppm

Photodegradation of aqueous bromine has been experimentally measured as reported in the table below. 1, min 10 20 30 40 50 60 c, ppm 3.4 2.6 1.6 1.3 1.0 0.5 Where c is the concentration of bromine in ppm and is time in minutes. The experimental data can be described by the function: c = 4.84 e-0.034t a) Create a plot in MATLAB displaying both the experimental data (using circle-shaped, filled- red symbols) and the function (using a blue, solid line). Plot the function for t=0 to 70 min. Include a title, x- & y-axis labels, grids and a legend. b) Evaluate the percent absolute relative errors in estimating the experimental concentration of bromine and represent them in a bar chart. c) A linearized form of the function is: In c = In 4.84 -0.034t. Create two plots in one Figure (use subplot). The top one plots the nonlinear data and function (same as part a), and the bottom one plots the linear data and function.
Step by Step Solution
★★★★★
3.53 Rating (150 Votes )
There are 3 Steps involved in it
Step: 1

Get Instant Access to Expert-Tailored Solutions
See step-by-step solutions with expert insights and AI powered tools for academic success
Step: 2

Step: 3

Ace Your Homework with AI
Get the answers you need in no time with our AI-driven, step-by-step assistance
Get Started


