

Answered step by step
Verified Expert Solution
Question
1 Approved Answer
pictures are for Q3 and Q4 look at exhibit 1.2.3.4 accordingly thank you Exhibit 1 Sippican Corporation: Operating Results (March 2006) 100% Sales Direct Labor
pictures are for Q3 and Q4
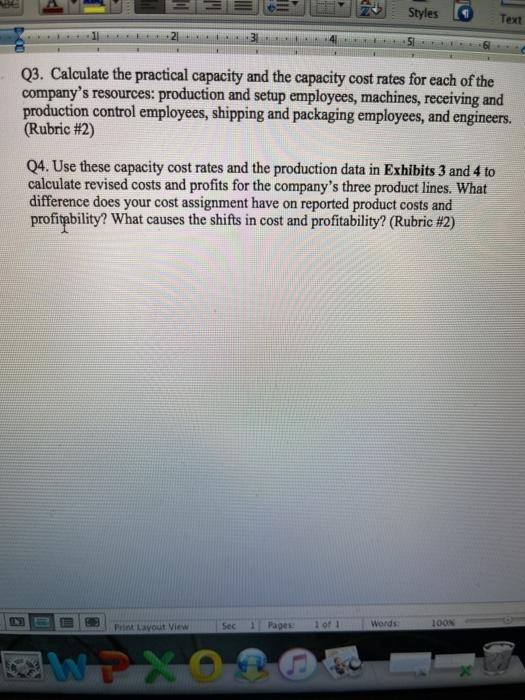
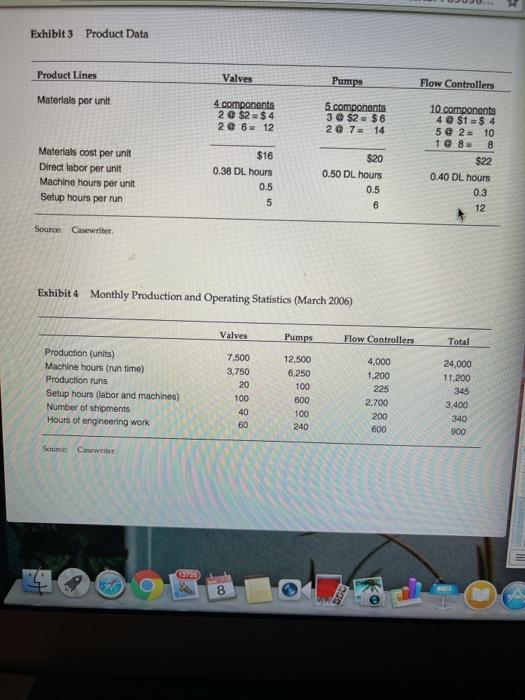
Exhibit 1 Sippican Corporation: Operating Results (March 2006) 100% Sales Direct Labor Expense Direct Materials Expense Contribution Margin Manufacturing Overhead $1.847,500 351,000 458.000 $1,038,500 56% Machine-related expenses Setup labor Receiving and production control Engineering Packaging and shipping Total Manufacturing Overhead Gross Margin General, Selling & Administrative Expenses Operating Income (pre-tax) $334,800 117,000 15,600 78,000 109,200 654,600 383.900 350.000 $33.900 35% 21% 19% 1.8% Source: Casewriter Exhibit 2 Product Profitability Analysis (March 2006) Valves Pumps Flow Controllers Direct labor cost Direct material cost Manufacturing overhead (185%) Standard unit costs Target selling price Planned gross margin (%) Actual selling price Actual gross margin Actual gross margin (%) $12.35 16.00 22.85 $51.20 $78.77 35% $79.00 527.80 3596 $16.25 20.00 30.06 $66.31 $102.02 35% S 70.00 $ 3.69 5% $13.00 22.00 24.05 $59.05 S90.85 35% $95.00 $35.95 3896 13720 8 Styles Text + Q3. Calculate the practical capacity and the capacity cost rates for each of the company's resources: production and setup employees, machines, receiving and production control employees, shipping and packaging employees, and engineers. (Rubric #2) Q4. Use these capacity cost rates and the production data in Exhibits 3 and 4 to calculate revised costs and profits for the company's three product lines. What difference does your cost assignment have on reported product costs and profitability? What causes the shifts in cost and profitability? (Rubric #2) Sec Print Layout View 1 Pages 1 of 1 Words 100N Exhibit 3 Product Data Product Lines Valves Pumps Flow Controllers Materials per unit 4 components 2 @ $2$ 4 2 @ 6-12 5.components 3 @ $2 = $6 2 @ 7 = 14 Materials cost per unit Direct labor per unit Machine hours per unit Setup hours per run $16 0.38 DL hours 0.5 5 10 components 4 @ $1 = $ 4 5 @ 210 1 @ 8 8 $22 0.40 DL hours 0.3 $20 0.50 DL hours 0.5 6 12 Source Carwriter Exhibit 4 Monthly Production and Operating Statistics (March 2006) Valves Pumps Flow Controllers Total Production (units) Machine hours (run time) Production runs Setup hours (labor and machines) Number of shipments Hours of engineering work 7,500 3,750 20 100 40 60 12,500 6,250 100 600 4,000 1,200 225 2.700 200 600 24,000 11,200 345 3,400 340 900 100 240 Source Center 3720 8 look at exhibit 1.2.3.4 accordingly
thank you 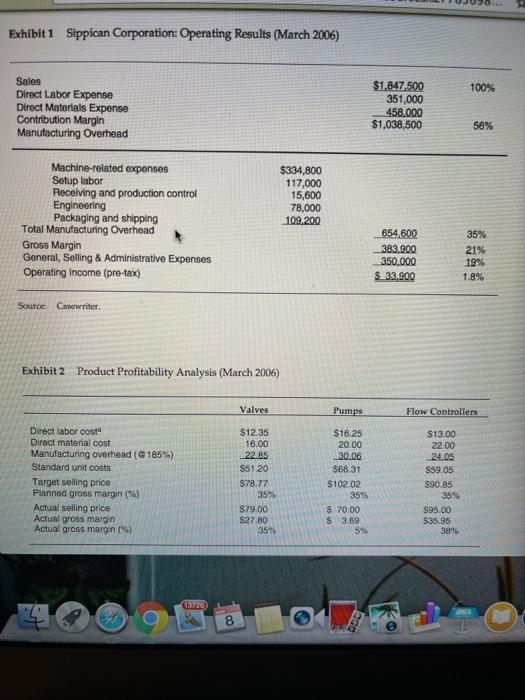
Step by Step Solution
There are 3 Steps involved in it
Step: 1

Get Instant Access to Expert-Tailored Solutions
See step-by-step solutions with expert insights and AI powered tools for academic success
Step: 2

Step: 3
Ace Your Homework with AI
Get the answers you need in no time with our AI-driven, step-by-step assistance
Get Started
CAT Paper 8 Implementing Audit Procedures
Authors: BPP Professional Education
1st Edition
0751723126, 978-0751723120