Answered step by step
Verified Expert Solution
Question
1 Approved Answer
Pie Charts Assignment In column A of a blank spreadsheet, list the categories of activities you spend ( or would like to spend ) time
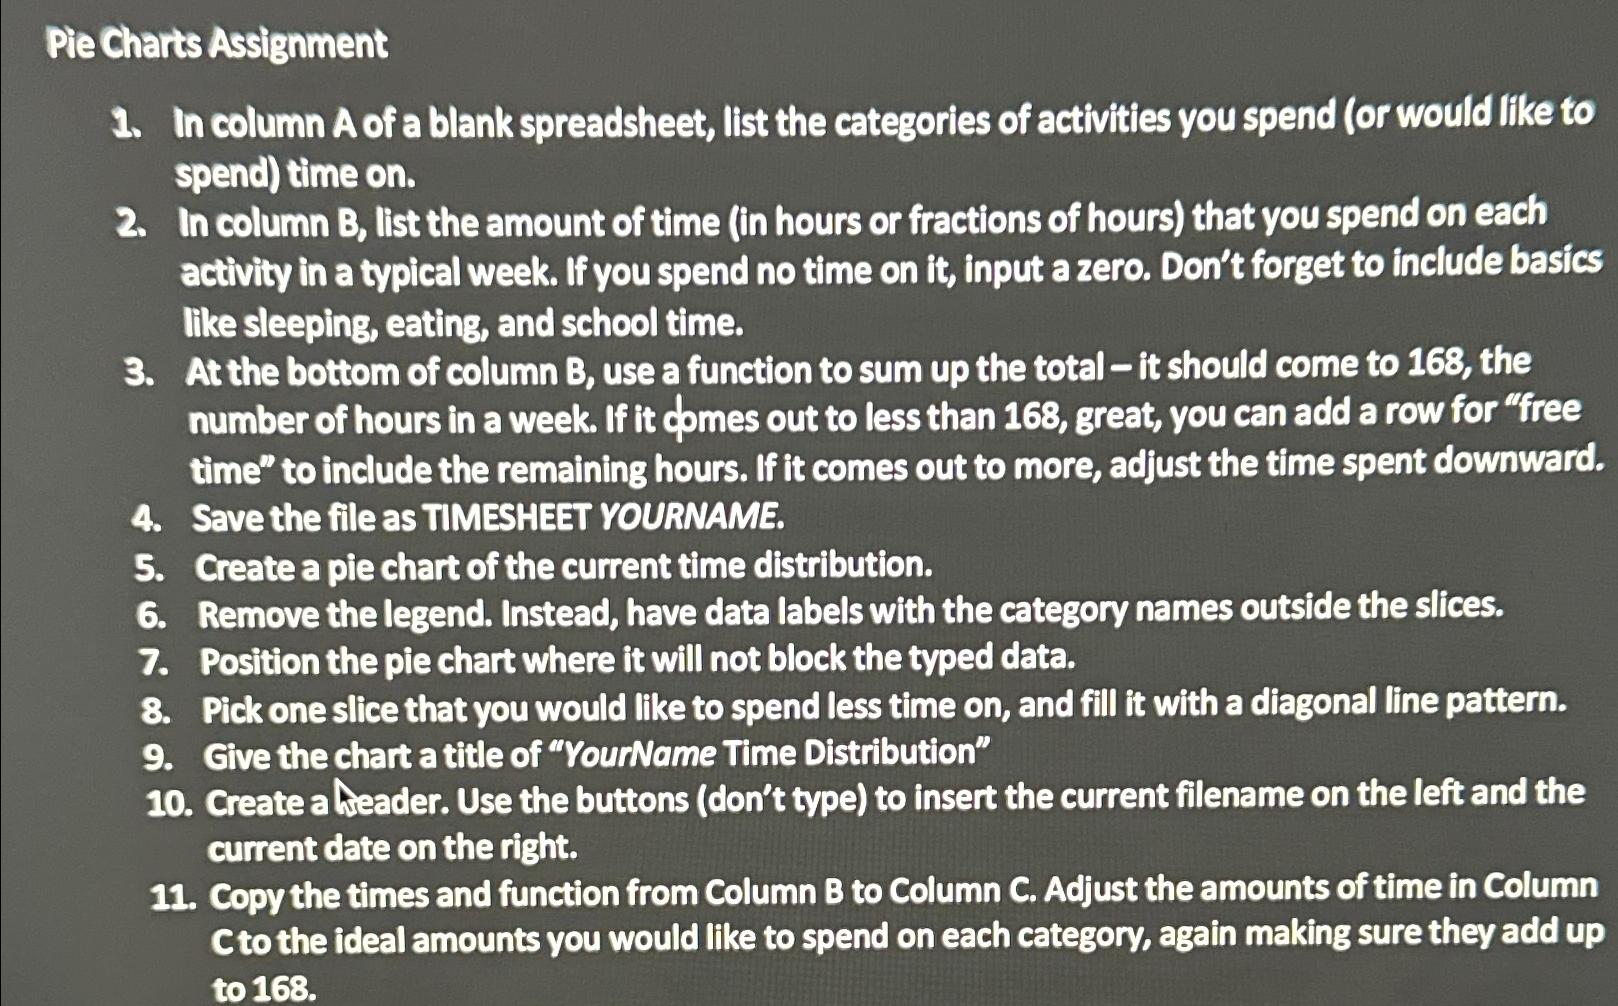
Pie Charts Assignment
In column A of a blank spreadsheet, list the categories of activities you spend or would like to spend time on
In column B list the amount of time in hours or fractions of hours that you spend on each activity in a typical week. If you spend no time on it input a zero. Don't forget to include basics like sleeping, eating, and school time.
At the bottom of column B use a function to sum up the total it should come to the number of hours in a week. If it domes out to less than great, you can add a row for "free time" to include the remaining hours. If it comes out to more, adjust the time spent downward.
Save the file as TIMESHEET YOURNAME.
Create a pie chart of the current time distribution.
Remove the legend. Instead, have data labels with the category names outside the slices.
Position the pie chart where it will not block the typed data.
Pick one slice that you would like to spend less time on and fill it with a diagonal line pattern.
Give the chart a title of "YourName Time Distribution"
Create a Aeader. Use the buttons dont type to insert the current filename on the left and the current date on the right.
Copy the times and function from Column B to Column C Adjust the amounts of time in Column Cto the ideal amounts you would like to spend on each category, again making sure they add up to
Step by Step Solution
There are 3 Steps involved in it
Step: 1

Get Instant Access to Expert-Tailored Solutions
See step-by-step solutions with expert insights and AI powered tools for academic success
Step: 2

Step: 3
Ace Your Homework with AI
Get the answers you need in no time with our AI-driven, step-by-step assistance
Get Started