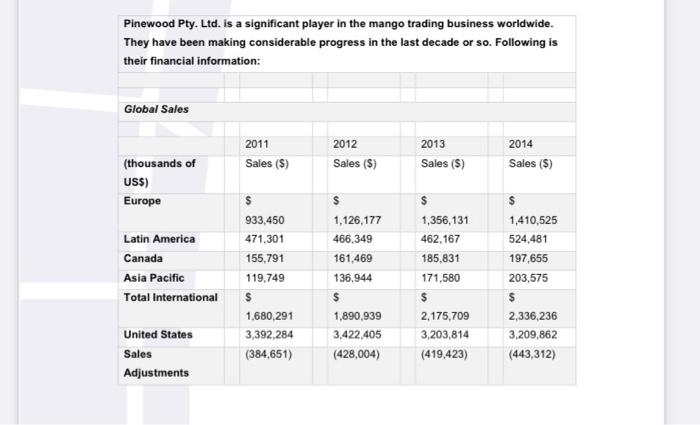
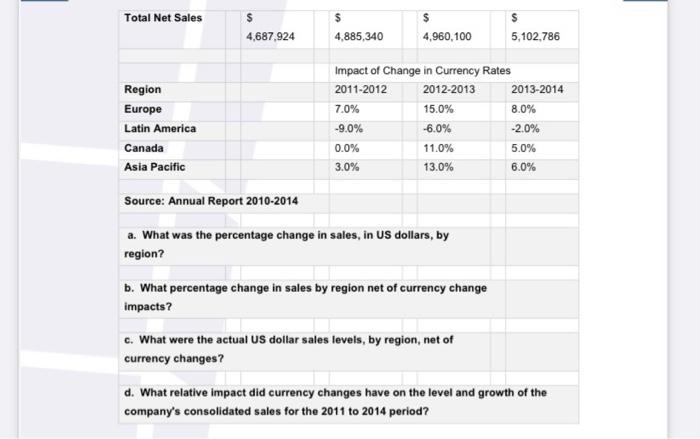
Pinewood Pty Ltd. is a significant player in the mango trading business worldwide. They have been making considerable progress in the last decade or so. Following is their financial information: Global Sales 2014 2011 Sales (5) 2012 Sales ($) 2013 Sales (5) Sales ($) (thousands of USS) Europe Latin America Canada Asia Pacific Total International $ 933.450 471,301 155.791 119.749 $ 1.680,291 3,392,284 (384,651) $ 1,126,177 466,349 161,469 136.944 $ 1,890,939 3,422,405 (428,004) $ 1,356,131 462,167 185,831 171,580 $ 2,175,709 3,203,814 (419,423) $ 1,410,525 524,481 197,655 203,575 $ 2,336,236 3,209,862 (443,312) United States Sales Adjustments Total Net Sales $ $ $ 4,960,100 4,687,924 4,885,340 5,102,786 Region Europe Latin America Canada Asia Pacific Impact of Change in Currency Rates 2011-2012 2012-2013 2013-2014 7.0% 15.0% 8.0% -9.0% -6.0% -2.0% 0.0% 11.0% 5.0% 3.0% 13.0% 6.0% Source: Annual Report 2010-2014 a. What was the percentage change in sales, in US dollars, by region? b. What percentage change in sales by region net of currency change impacts ? c. What were the actual US dollar sales levels, by region, net of currency changes? d. What relative impact did currency changes have on the level and growth of the company's consolidated sales for the 2011 to 2014 period? Pinewood Pty Ltd. is a significant player in the mango trading business worldwide. They have been making considerable progress in the last decade or so. Following is their financial information: Global Sales 2014 2011 Sales (5) 2012 Sales ($) 2013 Sales (5) Sales ($) (thousands of USS) Europe Latin America Canada Asia Pacific Total International $ 933.450 471,301 155.791 119.749 $ 1.680,291 3,392,284 (384,651) $ 1,126,177 466,349 161,469 136.944 $ 1,890,939 3,422,405 (428,004) $ 1,356,131 462,167 185,831 171,580 $ 2,175,709 3,203,814 (419,423) $ 1,410,525 524,481 197,655 203,575 $ 2,336,236 3,209,862 (443,312) United States Sales Adjustments Total Net Sales $ $ $ 4,960,100 4,687,924 4,885,340 5,102,786 Region Europe Latin America Canada Asia Pacific Impact of Change in Currency Rates 2011-2012 2012-2013 2013-2014 7.0% 15.0% 8.0% -9.0% -6.0% -2.0% 0.0% 11.0% 5.0% 3.0% 13.0% 6.0% Source: Annual Report 2010-2014 a. What was the percentage change in sales, in US dollars, by region? b. What percentage change in sales by region net of currency change impacts ? c. What were the actual US dollar sales levels, by region, net of currency changes? d. What relative impact did currency changes have on the level and growth of the company's consolidated sales for the 2011 to 2014 period


