

Question
Plan a Flight Introduction: You need to determine the shortest/cheapest flight plans for a person wishing to travel between two different cities serviced by an
Plan a Flight
Introduction:
You need to determine the shortest/cheapest flight plans for a person wishing to travel between two different cities serviced by an airline (assuming a path exists), using Dijkstras algorithm with priority queues. You will also calculate the total cost incurred for all parts of the trip. For this project, you will use information from two different input files in order to calculate the trip plan and total cost.
1. Origination and Destination Data This file will contain a sequence of city pairs representing different legs of flights that can be considered in preparing a flight plan. For each leg, the file will also contain a dollar cost for that leg and a time to travel1. For each pair in the file, you can assume that it is possible to fly only in one directions.
2. Requested Flights This file will contain a sequence of origin/destination city pairs. For each pair, your program will determine if the flight is or is not possible. If it is possible, it will output to a file the cheapest/shortest flight plan with the total cost for the flight. If it is not possible, then a suitable message will be written to the output file.
The names of the two input files as well as the output file will be provided via command line arguments.
Note: We will not be considering layovers.
Flight Data:
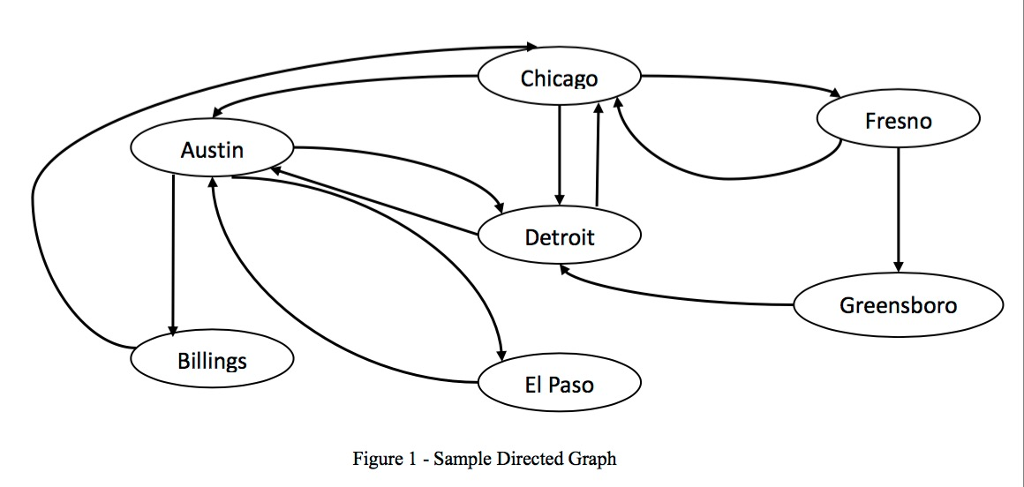
Consider a flight from Detroit to El Paso. Its possible that there is a direct flight, or it may be the case that a stop must be made in Austin. One stop in Austin would mean the flight would have two legs. We can think of the complete set of flights between different cities serviced by our airline as a directed graph. An example of a directed graph is given in Figure 1.
In this example, an arrow from one city to another indicates the direction of travel. The opposite direction is not possible unless a similar arrow is present in the graph. For this programming challenge, each arrow or flight path would also have a cost associated with it. If we wanted to travel from El Paso to city Chicago, we would have to pass through Austin and Detroit. This would be a trip with three legs (El Paso to Austin, Austin to Detroit and Detroit to Chicago). It is possible that there might not be a path from one city to another city. In this case, youd print an error message indicating such.
 The input file for flight data will represent a sequence of origin/destination city pairs with a cost of that flight. The first line of the input file will contain an integer which indicates the total number of origin/destination pairs contained in the file.
Sample Data
Flight Data:
Here is an example of a flight data input file (it is not one that goes with Figure 1):
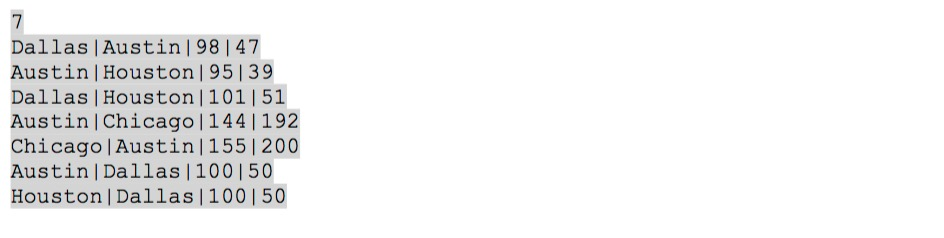
The first line of the file will contain an integer indicating how many rows of data will be in the file. Each subsequent row will contain two city names (from-city and to-city), the cost of the flight, and the number of minutes of the flight. Each field will be separated with a pipe (shift-\ on most keyboards).
Requested Flight Plans:
A sample input file for requested flight plans is shown below. The first line will contain an integer indicating the number of flight plans requested. The subsequent lines will contain a pipe- delimited list of city pairs with a trailing character to indicate sorting the output of flights by time (T) or cost (C). Your solution will find all flight paths between these two cities (if any exists) and calculate the total cost of the flights and the total time in the air.

Output File:
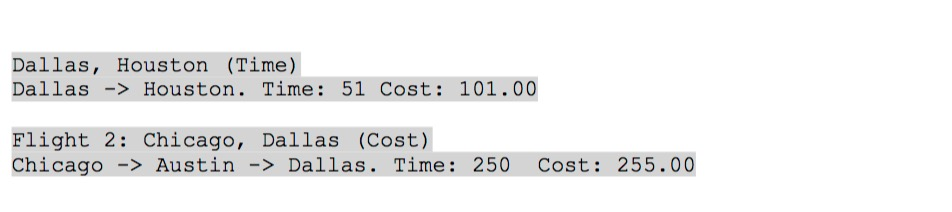
For each flight in the Requested Flight Plans file, your program will print the most efficient flight plan available based on whether the request was to order by time or cost. If no flight plan can be created, then a proper message should be printed. Here is an example:
Step by Step Solution
There are 3 Steps involved in it
Step: 1

Get Instant Access to Expert-Tailored Solutions
See step-by-step solutions with expert insights and AI powered tools for academic success
Step: 2

Step: 3
Ace Your Homework with AI
Get the answers you need in no time with our AI-driven, step-by-step assistance
Get Started
Transact SQL Cookbook Help For Database Programmers
Authors: Ales Spetic, Jonathan Gennick
1st Edition
1565927567, 978-1565927568