Answered step by step
Verified Expert Solution
Question
1 Approved Answer
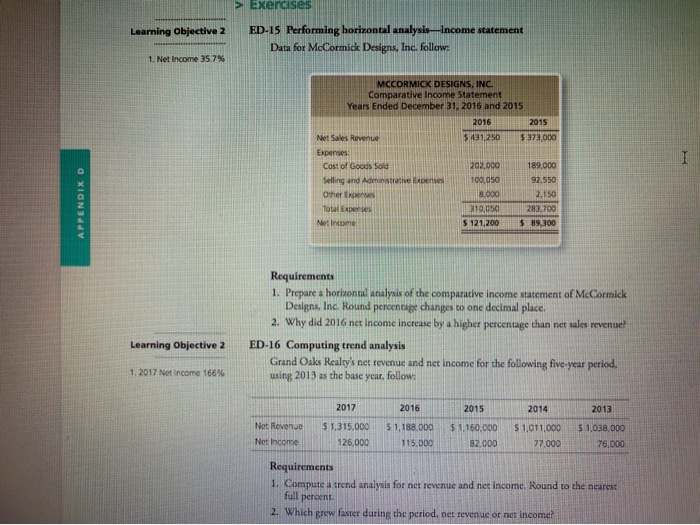
Pleaae complete ED-15 & ED-16 and all requirments in excel. please show excel formulas. thanks in advance > Exercises Learning Objective 2 ED-15 Performing horizontal
Pleaae complete ED-15 & ED-16 and all requirments in excel. please show excel formulas. 
> Exercises Learning Objective 2 ED-15 Performing horizontal analysis income statement Data for McCormick Designs, Inc. follow: 1. Net Income 35.7% MCCORMICK DESIGNS, INC Comparative Income Statement Years Ended December 31, 2016 and 2015 2016 2015 Net Sales Revenu 5431.250 $ 370,000 Expenses Cost of Goods Sold 202.000 189,000 Selling and Administrative Expenses 100,050 92,550 Other Expenses 8.000 2.150 Total Expenses 310,050 283.700 Net Income $ 121,200 $ 89,300 APPENDIXD Requirements 1. Prepare a horizontal analysis of the comparative Income statement of McCormick Designs, Inc. Round percentage changes to one decimal place. 2. Why did 2016 net income increase by a higher percentage than net sales revenue! ED-16 Computing trend analysis Grand Oaks Realty's net revenue and net income for the following five-year period. using 2013 as the base year, follow Learning Objective 2 1. 2017 Net income 166% 2017 2016 2015 2014 2013 Not Revenue Net Income $ 1,315,000 126,000 $ 1.188.000 115.000 $ 1.150.000 82.000 S 1.011,000 77.000 5 1,038,000 76.000 Requirements 1. Compute a trend analysis for net revenue and net income. Round to the nearest full percent 2. Which grew faster during the period, net revenue or net income thanks in advance

Step by Step Solution
There are 3 Steps involved in it
Step: 1

Get Instant Access to Expert-Tailored Solutions
See step-by-step solutions with expert insights and AI powered tools for academic success
Step: 2

Step: 3

Ace Your Homework with AI
Get the answers you need in no time with our AI-driven, step-by-step assistance
Get Started


