Answered step by step
Verified Expert Solution
Question
1 Approved Answer
Pleas do it in matlab. Thank you. Now that the raw satellite data has been assessed and cleaned, you can move on with a performance
Pleas do it in matlab. Thank you.
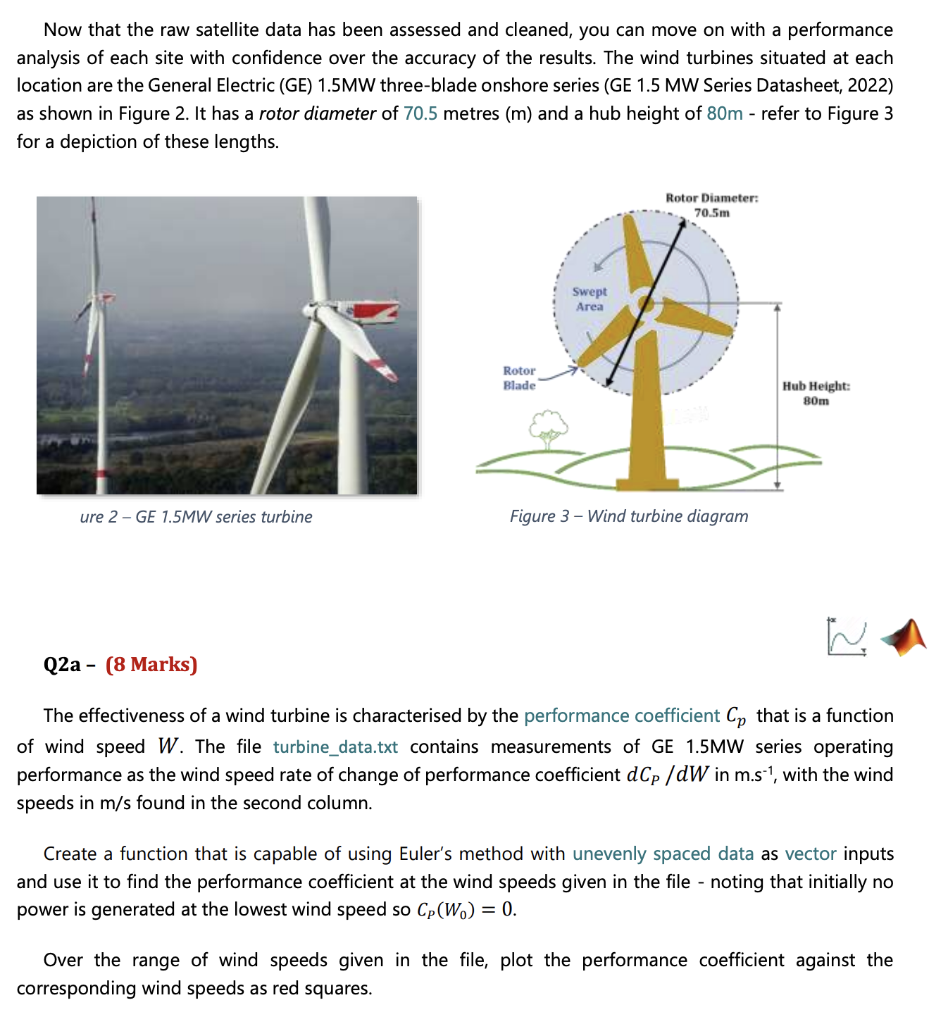
Now that the raw satellite data has been assessed and cleaned, you can move on with a performance analysis of each site with confidence over the accuracy of the results. The wind turbines situated at each location are the General Electric (GE) 1.5MW three-blade onshore series (GE 1.5 MW Series Datasheet, 2022) as shown in Figure 2. It has a rotor diameter of 70.5 metres (m) and a hub height of 80m - refer to Figure 3 for a depiction of these lengths. ure 2GE 7.5MW series turbine Q2a - (8 Marks) The effectiveness of a wind turbine is characterised by the performance coefficient Cp that is a function of wind speed W. The file turbine_data.txt contains measurements of GE 1.5MW series operating performance as the wind speed rate of change of performance coefficient dCP/dW in m1s1, with the wind speeds in m/s found in the second column. Create a function that is capable of using Euler's method with unevenly spaced data as vector inputs and use it to find the performance coefficient at the wind speeds given in the file - noting that initially no power is generated at the lowest wind speed so CP(W0)=0. Over the range of wind speeds given in the file, plot the performance coefficient against the corresponding wind speeds as red squaresStep by Step Solution
There are 3 Steps involved in it
Step: 1
Get Instant Access to Expert-Tailored Solutions
See step-by-step solutions with expert insights and AI powered tools for academic success
Step: 2
Step: 3
Ace Your Homework with AI
Get the answers you need in no time with our AI-driven, step-by-step assistance
Get Started