

Question
Please advise how on the following questions Midland Energy Assumptions and Questions To guide your analyses, you may want to answer the following questions within
Please advise how on the following questions
Midland Energy Assumptions and Questions
To guide your analyses, you may want to answer the following questions within your report:
- How are Mortensen's estimates of Midland's cost of capital used? How, if at all, should these anticipated uses affect the calculations?
- Calculate Midland's corporate WACC. Be prepared to defend your specific assumptions about the various inputs to the calculations. Is Midland's choice of EMRP appropriate? If not, what recommendations would you make and why?
- Should Midland use a single corporate hurdle rate for evaluating investment opportunities in all of its divisions? Why or why not?
- Compute a separate cost of capital for the E&P and Marketing & Refining divisions. What causes them to differ from one another?
- How would you compute a cost of capital for the Petrochemical division?
Source:
In late January 2007, Janet Mortensen, senior vice president of project finance for Midland Energy Resources, was preparing her annual cost of capital estimates for Midland and each of its three divisions. Midland was a global energy company with operations in oil and gas exploration and production (E&P), refining and marketing (R&M), and petrochemicals. On a consolidated basis, the firm had 2006 operating revenue and operating income of $248.5 billion and $42.2 billion, respectively.
Estimates of the cost of capital were used in many analyses within Midland, including asset appraisals for both capital budgeting and financial accounting, performance assessments, M&A proposals, and stock repurchase decisions. Some of these analyses were performed at the division or business unit level, while others were executed at the corporate level. Midland's corporate treasury staff had begun preparing annual cost of capital estimates for the corporation and each division in the early 1980s. The estimates produced by treasury were often criticized, and Midland's division presidents and controllers sometimes challenged specific assumptions and inputs.
In 2002, Mortensen, then a senior analyst reporting to the CFO, was asked to estimate Midland's cost of capital in connection with a large proposed share repurchase. Six months later she was asked to calculate corporate and divisional costs of capital that the executive and compensation committees of the board could incorporate in planned performance evaluations. Since then, Mortensen had undertaken a similar exercise each year and her estimates had become widely circulated de facto standards in many analyses throughout the company, even ones in which they were not formally required. By 2007 Mortensen was aware that her calculations had become influential and she devoted ever more time and care to their preparation. Lately she wondered whether they were actually appropriate for all applications and she was considering appending a sort of "user's guide" to the 2007 set of calculations.
Midland's Operations
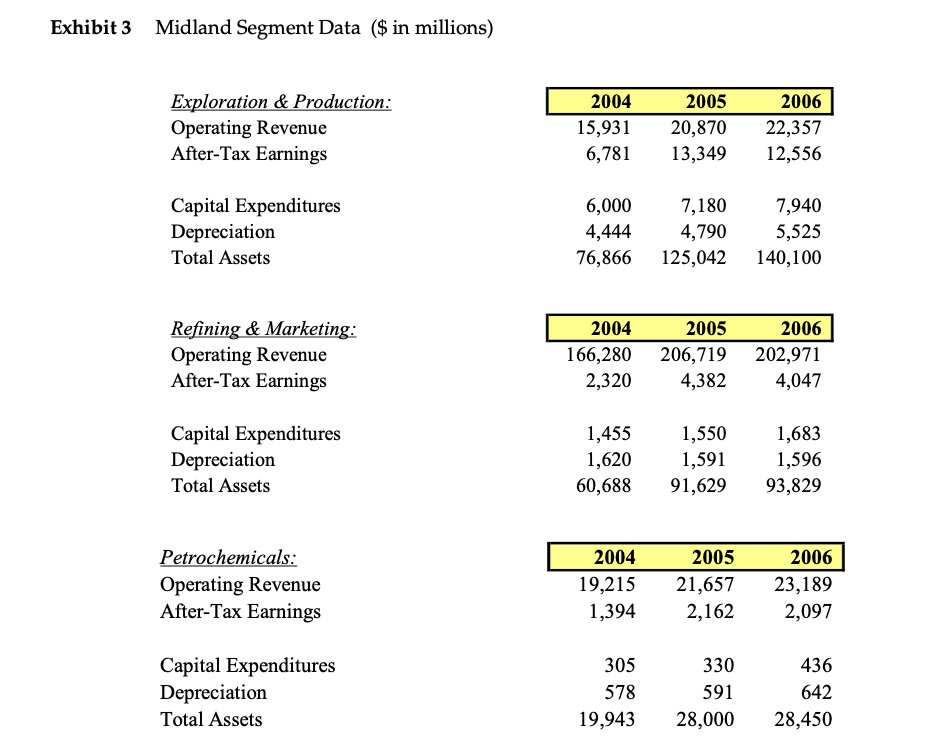
Midland Energy Resources had been incorporated more than 120 years previously and in 2007 had more than 80,000 employees.Exhibits 1and2present Midland's most recent consolidated financial statements.Exhibit 3presents selected business segment data for the period 2004-06.
Exploration & Production
Midland engaged in all phases of exploration, development, and production, though the last of these, production, dominated the E&P division's reported operating results. During 2006, Midland extracted approximately 2.10 million barrels of oil per day?a 6.3% increase over 2005 production? and roughly 7.28 billion cubic feet of natural gas per day?an increase of slightly less than 1% over 2005. This represented $22.4 billion of revenue and after-tax earnings of $12.6 billion. E&P was Midland's most profitable business, and its net margin over the previous five years was among the highest in the industry.
Midland expected continued global population and economic growth to result in rising demand for its products for the foreseeable future. Nevertheless, the fraction of production coming from non- traditional sources such as deepwater drilling, heavy oil recovery, liquefied natural gas (LNG), and arctic technology was expected to increase. Further, the geographic composition of output was shifting, marked by increases from places such as the Middle East, Central Asia, Russia, and West Africa.
With oil prices at historic highs in early 2007, Midland anticipated continued heavy investment in acquisitions of promising properties, in development of its proved undeveloped reserves, and in expanding production. In particular, continued high prices underlay plans to boost investment in sophisticated extraction methods that extended the lives of older fields and marginal properties. Capital spending in E&P was expected to exceed $8 billion in 2007 and 2008.
Refining and Marketing
Midland had ownership interests in 40 refineries around the world with distillation capacity of 5.0 million barrels a day. Measured by revenue, Midland's refining and marketing business was the company's largest. Global revenue for 2006 was $203.0 billion?a slight decrease of approximately 1.8% over 2005. The division faced stiff competition, as its products were highly commoditized. After-tax earnings for refining and marketing totaled only $4.0 billion. The relatively small margin was consistent with a long-term trend in the industry; margins had declined steadily over the previous 20 years.
Though most of Midland's refinery output was gasoline and was sold as fuel for automobiles, the company also had manufacturing capacity to produce approximately 120,000 barrels of base-stock lubricants per day. Midland believed its capacity was as technologically advanced as any in the industry. Advanced technology and vertical integration combined to make Midland a market leader in this business.
Midland projected capital spending in refining and marketing would remain stable, without substantial growth in 2007-08. This reflected both the historical trends of low and shrinking margins and the difficulty of obtaining the myriad approvals necessary to expand or to build and operate a new refinery. However, most analysts projected a longer-term global shortage of refining capacity that would eventually spur investment in this segment.
Petrochemicals was Midland's smallest division, but was a substantial business nonetheless. Midland owned outright or had equity interests in 25 manufacturing facilities and five research centers in eight countries around the world. The company's chemical products included polyethylene, polypropylene, styrene and polystyrene as well as olefins, 1-hexene, aromatics, and fuel and lubricant additives. In 2006, revenue and after-tax earnings were $23.2 billion and $2.1 billion, respectively.
Capital spending in petrochemicals was expected to grow in the near-term as several older facilities were sold or retired and replaced by newer, more efficient capacity. Much of the new investment would be undertaken by joint ventures outside the United States in which Midland's Petrochemicals Division owned a substantial minority interest.
Midland's Financial and Investment Policies
Midland's financial strategy in 2007 was founded on four pillars: (1) to fund significant overseas growth; (2) to invest in value-creating projects across all divisions; (3) to optimize its capital structure; and (4) to opportunistically repurchase undervalued shares.
Overseas Growth
The most easily exploited domestic resources had been put into production decades previously. Consequently, overseas investments were the main engine of growth for most large U.S. producers, and Midland was no exception. Midland usually invested in foreign projects alongside either a foreign government or a local business as partner. Often, these investments had specialized financial and contractual arrangements similar in many respects to project financing. In most cases, Midland acted as the lead developer of the project, for which it collected a management fee or royalty. Midland and its foreign partner shared the equity interest, with the foreign partner generally receiving at least 50% plus a preferred return. Despite the fact that the investments were located abroad, Midland analyzed and evaluated them in U.S. dollars by converting foreign currency cash flows to dollars and applying U.S. dollar discount rates. In 2006, Midland had earnings from equity affiliates of approximately $4.75 billion. The majority of these earnings, 77.7%, came from non-US investments.
Value-creating Investments
Midland used discounted cash flow methodologies to evaluate most prospective investments. Midland's DCF methods typically involved debt-free cash flows and a hurdle rate equal to or derived from the WACC for the project or division. However, Midland's interests in some overseas projects were instead analyzed as streams of future equity cash flows and discounted at a rate based on the cost of equity.
The performance of a business or division over a given historical period was measured in two main ways. The first was performance against plan over 1- , 3- , and 5-year periods. The second was based on "economic value added" (EVA), in which debt-free cash flows1were reduced by a capital
1For purposes of EVA calculations, the company defined debt-free cash flows as net operating profit after taxes (NOPAT), which is EBIT(1-t).
Business Segment:
Maturity:
1-Year 10-Year 30-Year
Rate: 4.54% 4.66% 4.98%
charge, and expressed in dollars.2The capital charge was computed as the WACC for the business or division times the amount of capital it employed during the period.
Optimal Capital Structure
Midland optimized its capital structure in large part by prudently exploiting the borrowing capacity inherent in its energy reserves and in long-lived productive assets such as refining facilities. Debt levels were regularly reevaluated and long-term targets set accordingly. In particular, changes in energy price levels were correlated with changes in Midland's stock price, and necessitated regular reassessments of optimal borrowing. In 2007 both oil prices and Midland's stock price were at historic highs, which?all else equal?increased the company's borrowing capacity. This in turn represented an opportunity to shield additional profits from taxes.
Each of Midland's divisions had its own target debt ratio. Targets were set based on considerations involving each division's annual operating cash flow and the collateral value of its identifiable assets. Targets themselves tended to be "sticky," but changes in the market value of specific collateral, such as oil reserves, or the market capitalization of the company as a whole could drive actual debt ratios away from corresponding targets.
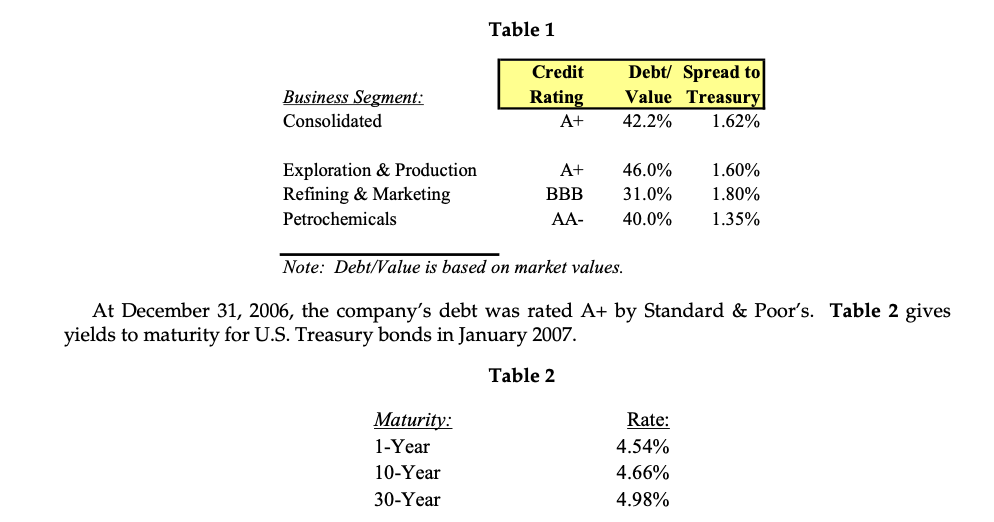
Mortensen's team did not set targets?they were set in consultations among division and corporate executives and the board?but Mortensen did estimate a debt rating for each division based on its target, and a corresponding spread over treasury bonds to estimate divisional and corporate costs of debt.3Mortensen's preliminary estimates for 2007 are shown below inTable 1.
Table 1
Consolidated A+ 42.2%
Exploration & Production A+ 46.0% Refining & Marketing BBB 31.0% Petrochemicals AA- 40.0%
Note: Debt/Value is based on market values.
1.62%
1.60% 1.80% 1.35%
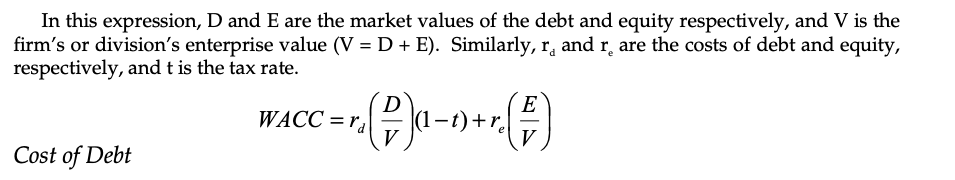
At December 31, 2006, the company's debt was rated A+ by Standard & Poor's.Table 2gives yields to maturity for U.S. Treasury bonds in January 2007.
Table 2
Credit Debt/ Spreadto Rating Value Treasury
Finally, although prudent use of Midland's debt capacity was a primary determinant of capital structure, other considerations played important roles as well. In particular, the strength of
2The basic EVA equation employed by Midland was EVA = NOPAT - (rwacc)(Invested Capital).
3The spread to Treasury refers to the amount the borrower will have to pay in interest cost above U.S. Treasury securities of a similar maturity.
4BRIEFCASES| HARVARD BUSINESS SCHOOL This document is authorized for use only by Alayne Murphy in FIN555_Fall2021_section 170 taught by SBASTIEN MICHENAUD, DePaul University from Sep 2021 to Feb 2022.
Midland's consolidated balance sheet and its access to global financial and commodity markets sometimes presented attractive opportunities to trade securities and commodities. Midland was conservative compared to some of its large competitors, but it did have a group of traders in-house who actively managed currency, interest rate, and commodity risks within a set of guidelines approved by the board. The desire to manage certain risks, or to take advantage of private information or unusual pricing relationships, was an additional reason that the actual capital structure sometimes departed, temporarily, from planned targets.
Stock Repurchases
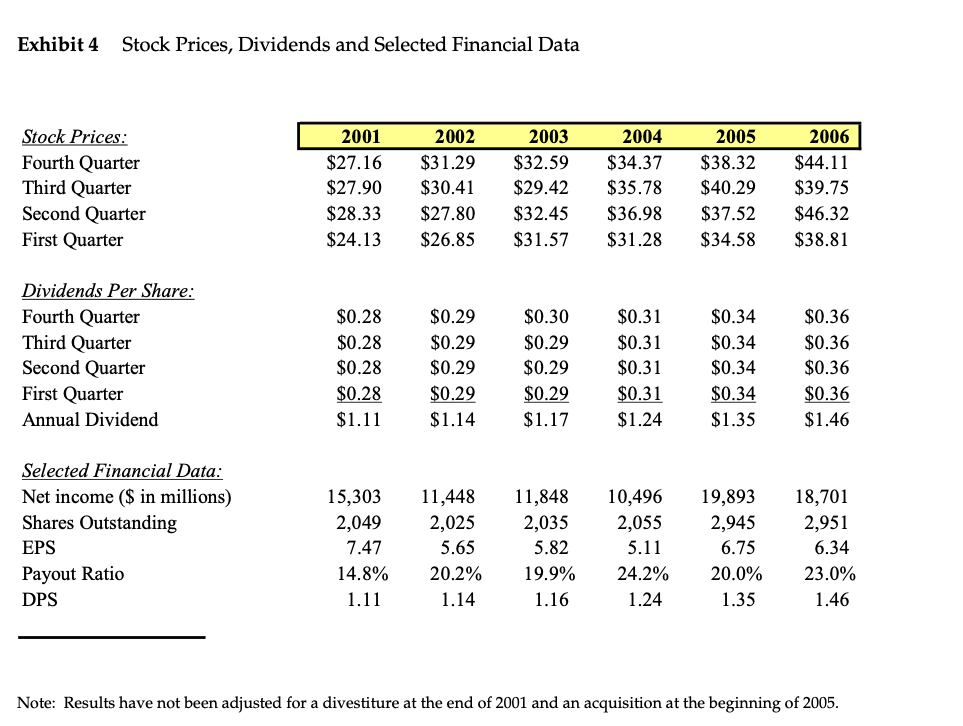
In the past, Midland had repurchased its own shares on occasion, and had stated that it would do so again whenever attractive opportunities arose. Consequently, the company regularly estimated the intrinsic value of its shares by subtracting the market value of its debt from the fundamental value of the enterprise and dividing the result by the number of shares outstanding. The fundamental value of the consolidated enterprise was estimated using DCF analyses and a comparison of the company's trading multiples with those of its peers. When the stock price fell below the stock's intrinsic value, Midland considered repurchasing its shares. Small numbers of shares could be purchased on the open market; larger blocks would be bought via self-tenders.
Midland had not repurchased shares in large numbers since 2002 and no large purchases were anticipated by analysts in the near future, given the company's high stock price. Nevertheless, Midland executives pointed out that the mere fact that the stock price had risen did not mean the shares were not undervalued - intrinsic value had clearly risen as well, and Midland remained committed to repurchasing shares when they were undervalued.Exhibit 4shows Midland's historical stock prices, dividends per share, and selected financial data for the period 2001-06.
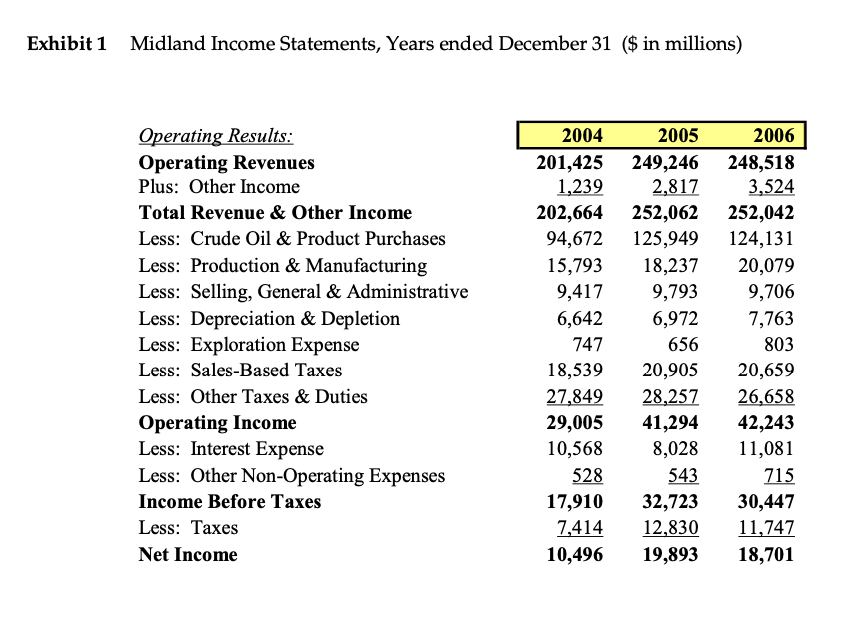
Estimating the Cost of Capital
Mortensen's primary calculations were based on the formula for WACC shown below.
In this expression, D and E are the market values of the debt and equity respectively, and V is the firm's or division's enterprise value (V = D + E). Similarly, rdand reare the costs of debt and equity, respectively, and t is the tax rate.
Cost of Debt
?D? ?E?WACC=rd??V??(1?t)+re??V??
Mortensen computed the cost of debt for each division by adding a premium, or spread, over U.S. Treasury securities of a similar maturity. The spread depended on a variety of factors, including the division's cash flow from operations, the collateral value of the division's assets, and overall credit market conditions. For some of Midland's operations, long-term expected cash flow and collateral value were affected by political risk. This risk was most apparent, for example, in the exploration and production division. A significant fraction of E&P's productive assets and proven reserves were located in politically volatile countries in which the risk of nationalization or a forced renegotiation of production rights was significant. All else equal, such properties supported less borrowing than might otherwise be expected.
4129|Midland Energy Resources, Inc.: Cost of Capital
For the exclusive use of A. Murphy, 2021.
Cost of Equity
To estimate the cost of equity, Mortensen used the Capital Asset Pricing Model (CAPM), shown below, in which rfdenotes the risk-free rate of return,?is a measure of systematic risk, and EMRP denotes the equity market risk premium, that is, the amount by which the return on a broadly diversified portfolio of risky assets is expected to exceed the risk-free return over a specific holding period.
re= rf+?(EMRP)
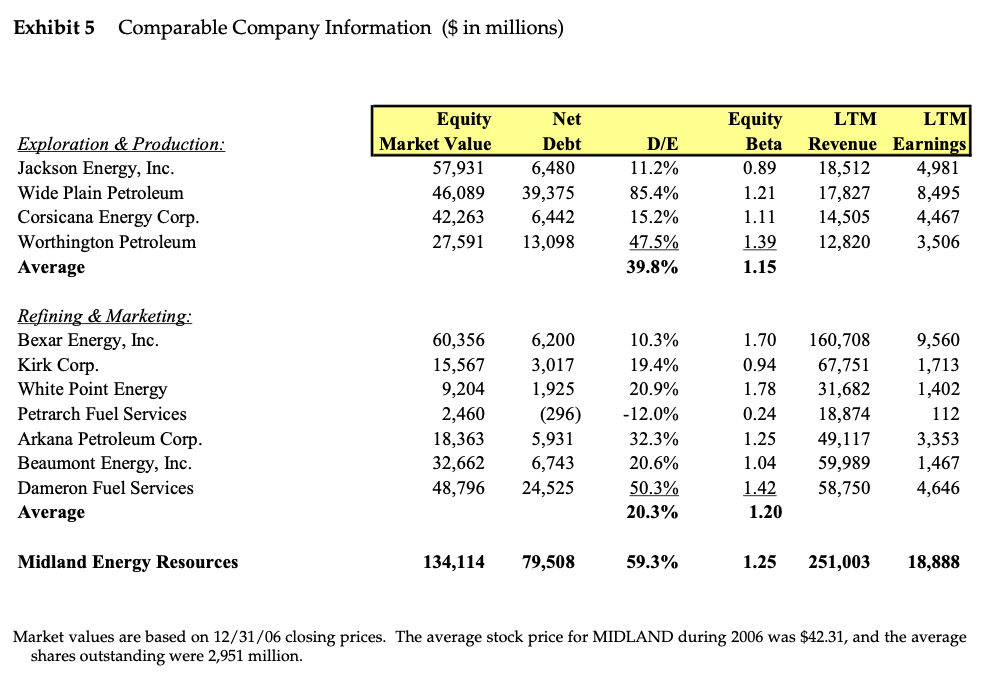
Mortensen was aware that betas were measured, with error, from regressions of individual stock returns on market returns. She and her team used betas published in commercially available databases, rather than running their own regressions. Midland's beta was 1.25, for example. However, betas for Midland's divisions were not observable, since the divisions did not have traded shares of stock. To estimate betas for the divisions, Mortensen relied on published betas for publicly traded companies she deemed comparable to each division's business. A selection of these, along with related financial data, is presented inExhibit 5.
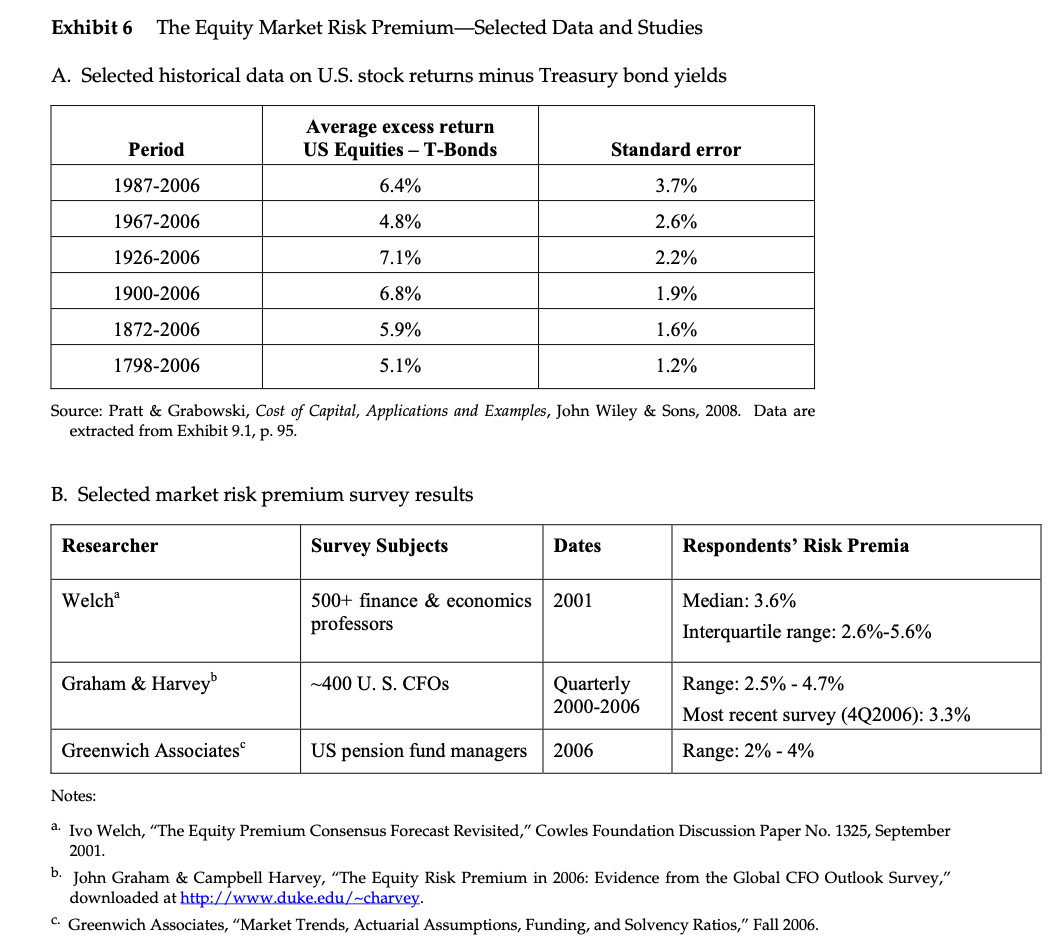
In 2006 Midland used an equity market risk premium of 5.0%, but higher EMRPs?6.0% to 6.5%? had been used by Midland at various times in the past. Historical data on stock returns and bond yields, such as those presented inExhibit 6,supported the higher estimates of the EMRP. Other data, such as the survey results shown inExhibit 6,suggested lower figures. Midland adopted its current estimate of 5.0% after a review of recent research and in consultation with its professional advisors? primarily its bankers and auditors?as well as Wall Street analysts covering the industry.
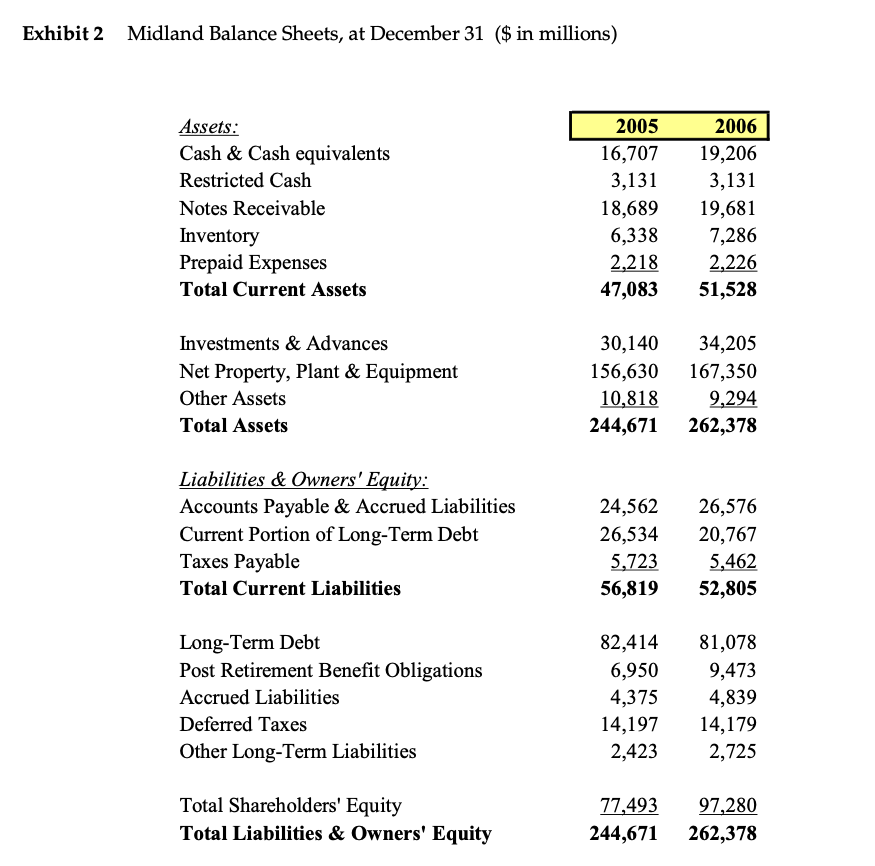
Exhibit 1
Midland Income Statements, Years ended December 31 ($ in millions)
Operating Results:
Operating Revenues
Plus: Other Income
Total Revenue & Other Income
Less: Crude Oil & Product Purchases Less: Production & Manufacturing Less: Selling, General & Administrative Less: Depreciation & Depletion
Less: Exploration Expense Less: Sales-Based Taxes Less: Other Taxes & DutiesOperating Income
Less: Interest Expense Less: Other Non-Operating ExpensesIncome Before Taxes Less: Taxes Net Income
2004
201,425
1,239
202,664
94,672 15,793 9,417 6,642 747 18,539 27,84929,00510,568 52817,9107,41410,496
2005
249,246
2,817
252,062
125,949 18,237 9,793 6,972 656 20,905 28,25741,2948,028 54332,72312,83019,893
2006
248,518
3,524
252,042
124,131 20,079 9,706 7,763 803 20,659 26,65842,24311,081 71530,44711,74718,701
Step by Step Solution
There are 3 Steps involved in it
Step: 1

Get Instant Access to Expert-Tailored Solutions
See step-by-step solutions with expert insights and AI powered tools for academic success
Step: 2

Step: 3
Ace Your Homework with AI
Get the answers you need in no time with our AI-driven, step-by-step assistance
Get Started
Financial management theory and practice
Authors: Eugene F. Brigham and Michael C. Ehrhardt
12th Edition
978-0030243998, 30243998, 324422695, 978-0324422696