

Question
Please analyse these financial statements and documents and elaborate on the most important aspect (profitability etc..) around 500 words if possible Question 1: Please elaborate
Please analyse these financial statements and documents and elaborate on the most important aspect (profitability etc..) around 500 words if possible
Question 1: Please elaborate and analyse these financial documents. The most important parts please. If possible, provide recommendation for the company moving into the future.
I guarantee a like and really good comment.
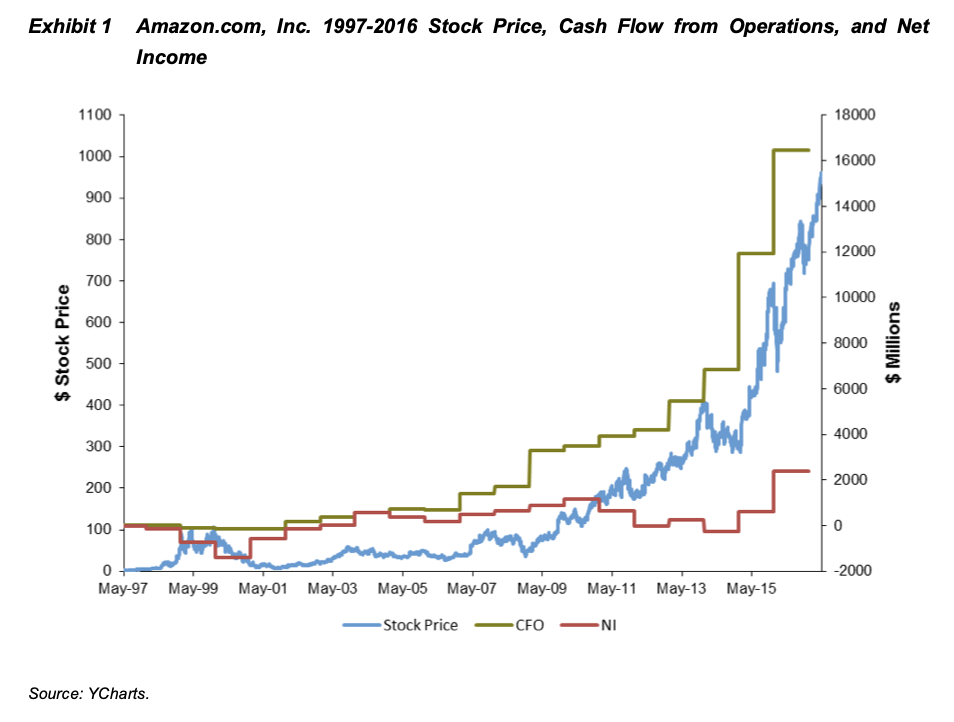
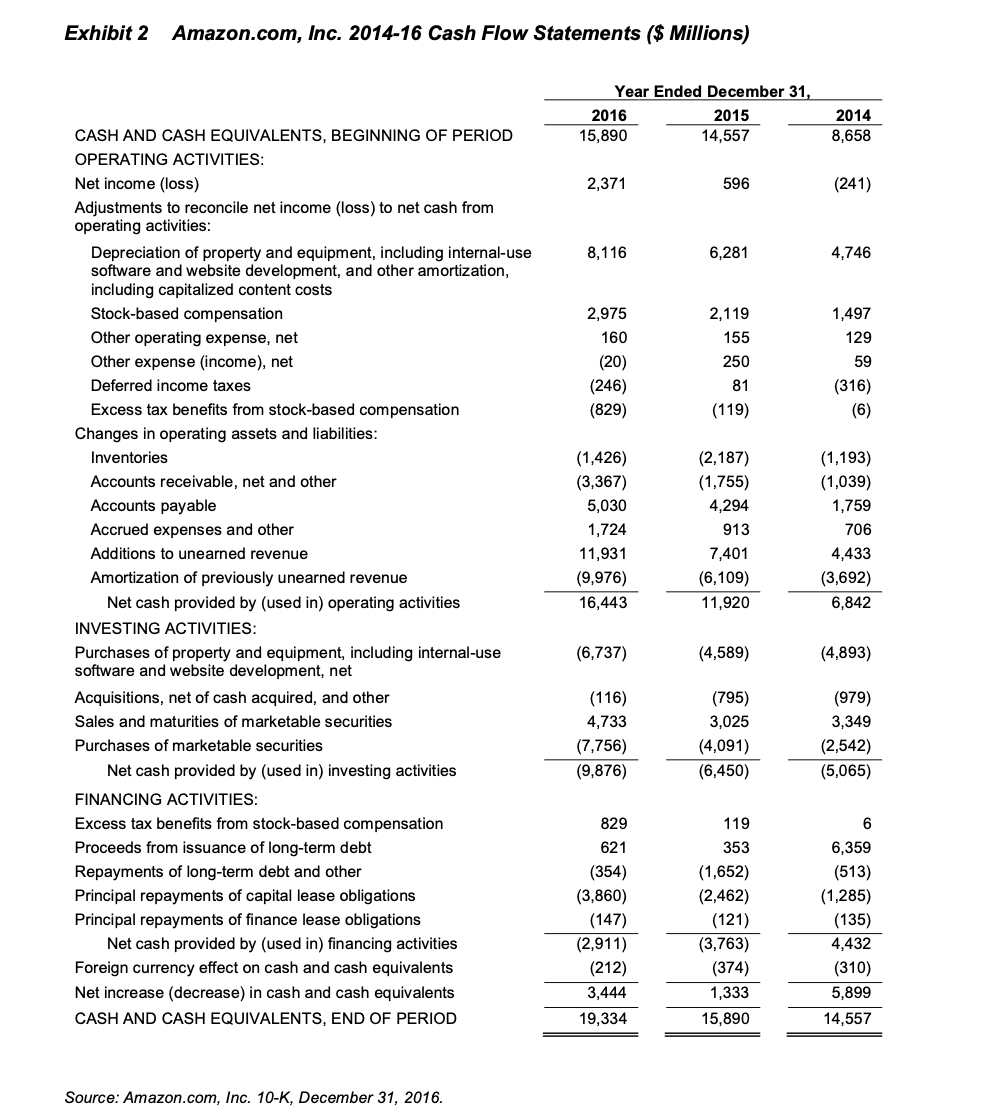
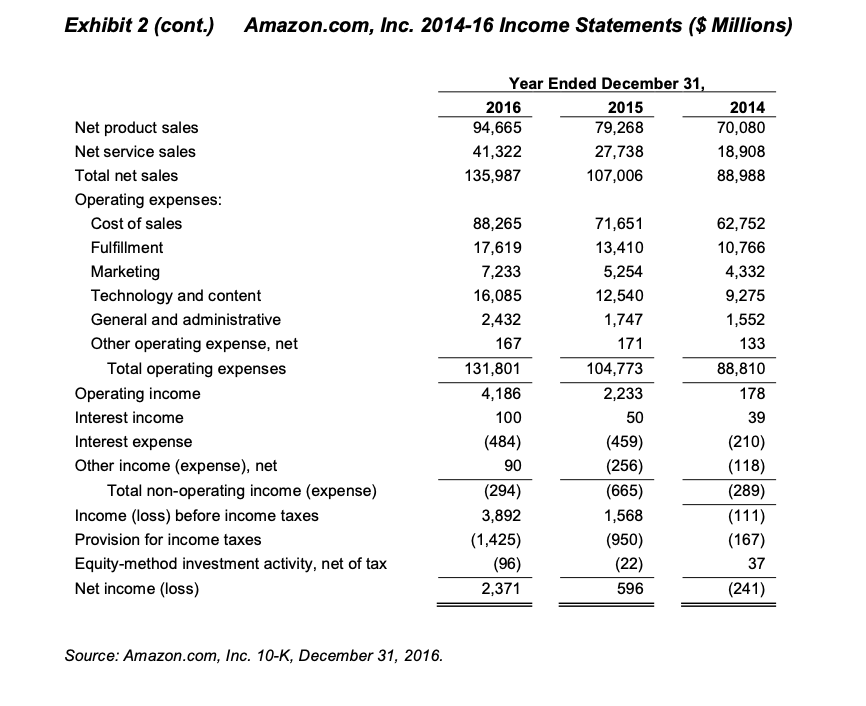
Exhibit 1 Amazon.com, Inc. 1997-2016 Stock Price, Cash Flow from Operations, and Net , Income 1100 18000 1000 16000 900 14000 800 12000 700 10000 600 $ Stock Price 8000 $ Millions 500 6000 400 4000 300 200 2000 100 0 -2000 0 May-97 May-99 May-01 May-03 May-05 May-07 May-09 May-11 May-13 May-15 Stock Price -CFO NI Source: YCharts. Exhibit 2 Amazon.com, Inc. 2014-16 Cash Flow Statements ($ Millions) Year Ended December 31, 2016 2015 15,890 14,557 2014 8,658 2,371 596 (241) 8,116 6,281 4,746 1,497 129 2,975 160 (20) (246) (829) 2,119 155 250 81 (119) 59 (316) (6) CASH AND CASH EQUIVALENTS, BEGINNING OF PERIOD OPERATING ACTIVITIES: Net income (loss) Adjustments to reconcile net income (loss) to net cash from operating activities: Depreciation of property and equipment, including internal-use software and website development, and other amortization, including capitalized content costs Stock-based compensation Other operating expense, net Other expense (income), net Deferred income taxes Excess tax benefits from stock-based compensation Changes in operating assets and liabilities: Inventories Accounts receivable, net and other Accounts payable Accrued expenses and other Additions to unearned revenue Amortization of previously unearned revenue Net cash provided by (used in) operating activities INVESTING ACTIVITIES: Purchases of property and equipment, including internal-use software and website development, net Acquisitions, net of cash acquired, and other Sales and maturities of marketable securities Purchases of marketable securities Net cash provided by (used in) investing activities FINANCING ACTIVITIES: Excess tax benefits from stock-based compensation Proceeds from issuance of long-term debt Repayments of long-term debt and other Principal repayments of capital lease obligations Principal repayments of finance lease obligations Net cash provided by (used in) financing activities Foreign currency effect on cash and cash equivalents Net increase (decrease) in cash and cash equivalents CASH AND CASH EQUIVALENTS, END OF PERIOD (1,426) (3,367) 5,030 1,724 11,931 (9,976) 16,443 (2,187) (1,755) 4,294 913 7,401 (6,109) 11,920 (1,193) (1,039) 1,759 706 4,433 (3,692) 6,842 (6,737) (4,589) (4,893) (116) 4,733 (7,756) (9,876) (795) 3,025 (4,091) (6,450) (979) 3,349 (2,542) (5,065) 6 829 621 (354) (3,860) (147) (2,911) (212) 3,444 19,334 119 353 (1,652) (2,462) (121) (3,763) (374) 1,333 15,890 6,359 (513) (1,285) (135) 4,432 (310) 5,899 14,557 Source: Amazon.com, Inc. 10-K, December 31, 2016. Exhibit 2 (cont.) Amazon.com, Inc. 2014-16 Income Statements ($ Millions) Year Ended December 31, 2016 2015 94,665 79,268 41,322 27,738 135,987 107,006 2014 70,080 18,908 88,988 Net product sales Net service sales Total net sales Operating expenses: Cost of sales Fulfillment Marketing Technology and content General and administrative Other operating expense, net Total operating expenses Operating income Interest income Interest expense Other income (expense), net Total non-operating income (expense) Income (loss) before income taxes Provision for income taxes Equity-method investment activity, net of tax Net income (loss) 71,651 13,410 5,254 12,540 1,747 171 104,773 2,233 62,752 10,766 4,332 9,275 1,552 133 88,810 178 88,265 17,619 7,233 16,085 2,432 167 131,801 4,186 100 (484) 90 (294) 3,892 (1,425) (96) 2,371 50 39 (459) (256) (665) 1,568 (950) (22) 596 (210) (118) (289) (111) (167) 37 (241) Source: Amazon.com, Inc. 10-K, December 31, 2016. Exhibit 1 Amazon.com, Inc. 1997-2016 Stock Price, Cash Flow from Operations, and Net , Income 1100 18000 1000 16000 900 14000 800 12000 700 10000 600 $ Stock Price 8000 $ Millions 500 6000 400 4000 300 200 2000 100 0 -2000 0 May-97 May-99 May-01 May-03 May-05 May-07 May-09 May-11 May-13 May-15 Stock Price -CFO NI Source: YCharts. Exhibit 2 Amazon.com, Inc. 2014-16 Cash Flow Statements ($ Millions) Year Ended December 31, 2016 2015 15,890 14,557 2014 8,658 2,371 596 (241) 8,116 6,281 4,746 1,497 129 2,975 160 (20) (246) (829) 2,119 155 250 81 (119) 59 (316) (6) CASH AND CASH EQUIVALENTS, BEGINNING OF PERIOD OPERATING ACTIVITIES: Net income (loss) Adjustments to reconcile net income (loss) to net cash from operating activities: Depreciation of property and equipment, including internal-use software and website development, and other amortization, including capitalized content costs Stock-based compensation Other operating expense, net Other expense (income), net Deferred income taxes Excess tax benefits from stock-based compensation Changes in operating assets and liabilities: Inventories Accounts receivable, net and other Accounts payable Accrued expenses and other Additions to unearned revenue Amortization of previously unearned revenue Net cash provided by (used in) operating activities INVESTING ACTIVITIES: Purchases of property and equipment, including internal-use software and website development, net Acquisitions, net of cash acquired, and other Sales and maturities of marketable securities Purchases of marketable securities Net cash provided by (used in) investing activities FINANCING ACTIVITIES: Excess tax benefits from stock-based compensation Proceeds from issuance of long-term debt Repayments of long-term debt and other Principal repayments of capital lease obligations Principal repayments of finance lease obligations Net cash provided by (used in) financing activities Foreign currency effect on cash and cash equivalents Net increase (decrease) in cash and cash equivalents CASH AND CASH EQUIVALENTS, END OF PERIOD (1,426) (3,367) 5,030 1,724 11,931 (9,976) 16,443 (2,187) (1,755) 4,294 913 7,401 (6,109) 11,920 (1,193) (1,039) 1,759 706 4,433 (3,692) 6,842 (6,737) (4,589) (4,893) (116) 4,733 (7,756) (9,876) (795) 3,025 (4,091) (6,450) (979) 3,349 (2,542) (5,065) 6 829 621 (354) (3,860) (147) (2,911) (212) 3,444 19,334 119 353 (1,652) (2,462) (121) (3,763) (374) 1,333 15,890 6,359 (513) (1,285) (135) 4,432 (310) 5,899 14,557 Source: Amazon.com, Inc. 10-K, December 31, 2016. Exhibit 2 (cont.) Amazon.com, Inc. 2014-16 Income Statements ($ Millions) Year Ended December 31, 2016 2015 94,665 79,268 41,322 27,738 135,987 107,006 2014 70,080 18,908 88,988 Net product sales Net service sales Total net sales Operating expenses: Cost of sales Fulfillment Marketing Technology and content General and administrative Other operating expense, net Total operating expenses Operating income Interest income Interest expense Other income (expense), net Total non-operating income (expense) Income (loss) before income taxes Provision for income taxes Equity-method investment activity, net of tax Net income (loss) 71,651 13,410 5,254 12,540 1,747 171 104,773 2,233 62,752 10,766 4,332 9,275 1,552 133 88,810 178 88,265 17,619 7,233 16,085 2,432 167 131,801 4,186 100 (484) 90 (294) 3,892 (1,425) (96) 2,371 50 39 (459) (256) (665) 1,568 (950) (22) 596 (210) (118) (289) (111) (167) 37 (241) Source: Amazon.com, Inc. 10-K, December 31, 2016Step by Step Solution
There are 3 Steps involved in it
Step: 1

Get Instant Access to Expert-Tailored Solutions
See step-by-step solutions with expert insights and AI powered tools for academic success
Step: 2

Step: 3
Ace Your Homework with AI
Get the answers you need in no time with our AI-driven, step-by-step assistance
Get Started
Financial and Managerial Accounting
Authors: Horngren, Harrison, Oliver
3rd Edition
978-0132497992, 132913771, 132497972, 132497999, 9780132913775, 978-0132497978