Answered step by step
Verified Expert Solution
Question
1 Approved Answer
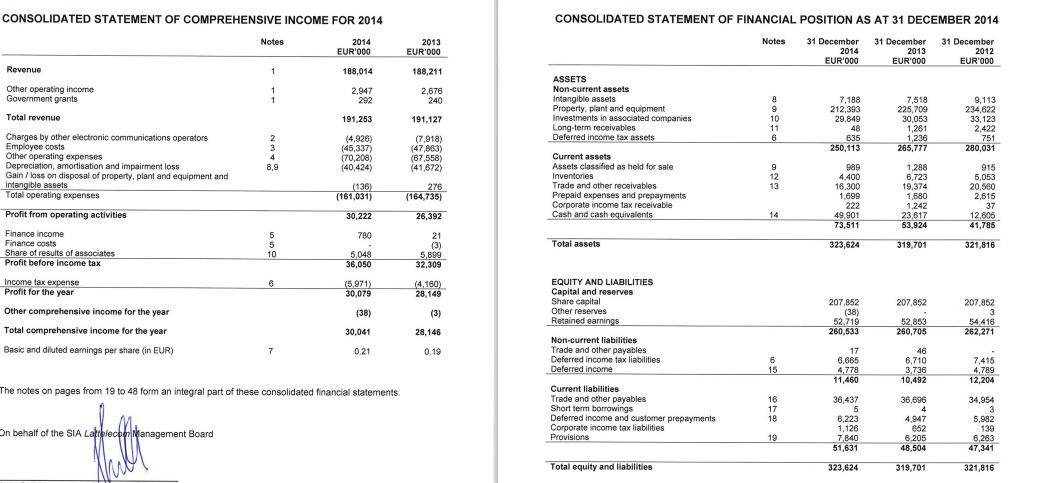
Please, analyze liquidity and solvency ratios of this company (any period) and provide your conclusions. CONSOLIDATED STATEMENT OF COMPREHENSIVE INCOME FOR 2014 CONSOLIDATED STATEMENT OF

Please, analyze liquidity and solvency ratios of this company (any period) and provide your conclusions.
CONSOLIDATED STATEMENT OF COMPREHENSIVE INCOME FOR 2014 CONSOLIDATED STATEMENT OF FINANCIAL POSITION AS AT 31 DECEMBER 2014 Notes Notes 2014 EUR'000 2013 EUR'000 31 December 2014 EUR'000 31 December 2013 EUR'000 31 December 2012 EUR'000 Revenue 1 188,014 188,211 Other operating income Government grants 1 1 2.947 292 2,676 240 ASSETS Non-current assets Intangible assets Property, plant and equipment Investments in associated companies Long-term receivables Deferred income tax assets Total revenue 191 253 191,127 8 9 10 11 6 7,188 212,393 29,849 48 636 250,113 7,518 225,709 30.053 1,261 1,236 265,777 9,113 234,622 33,123 2,422 751 280,031 Charges by other electronic communications operators Employee costs Other operating expenses Depreciation, amortisation and impairment loss Gain / loss on disposal of property, plant and equipment and intangible assets Total operating expenses 2 3 4 8,9 (4.926) (45,337) (70,208) (40,424) (136) (161,031) ( (7.918) (47,863) (67,558) (41,672) Current assets Assets classified as held for sale Inventories 9 12 13 276 ( (164,735) 26,392 Trade and other receivables Prepaid expenses and prepayments Corporate income tax receivable Cash and cash equivalents 989 4.400 16,300 1.699 222 49,901 73,511 1,288 6.723 19.374 1.680 1.242 23.817 53,924 915 5,053 20,560 2,615 37 12,805 41,785 Profit from operating activities 30,222 14 780 5 5 10 Total assets Finance income Finance costs Share of results of associates Profit before income tax 323,624 319,701 321,816 5,048 36,050 21 (3) 5,899 32,309 Income tax expense Profit for the year 6 (5,971) 30,079 14,160) 28,149 207,852 (38) (3) Other comprehensive income for the year Total comprehensive income for the year Basic and diluted earnings per share (in EUR) ( EQUITY AND LIABILITIES Capital and reserves Share capital Other reserves Retained earnings Non-current liabilities Trade and other payables Deferred income tax liabilities Deferred income 207 852 (38) 52.719 260,533 52.853 260,705 207,852 3 54,416 262,271 30.041 28,146 0.21 0.19 6 15 17 6,665 4,778 11,460 46 6,710 3,736 10,492 7,415 4,789 12,204 The notes on pages from 19 to 48 form an integral part of these consolidated financial statements Current liabilities Trade and other payables Short term borrowings Deferred income and customer prepayments Corporate income tax liabilities Provisions 16 17 18 36,437 5 5 6.223 36.896 4 4.947 662 6205 48,504 1,126 34,954 3 5,982 139 8,263 47,341 On behalf of the SIA Lattelecoor Nanagement Board 19 7.B40 51,631 Total equity and liabilities 323,624 319,701 321,816Step by Step Solution
There are 3 Steps involved in it
Step: 1

Get Instant Access to Expert-Tailored Solutions
See step-by-step solutions with expert insights and AI powered tools for academic success
Step: 2

Step: 3

Ace Your Homework with AI
Get the answers you need in no time with our AI-driven, step-by-step assistance
Get Started


