

Answered step by step
Verified Expert Solution
Question
1 Approved Answer
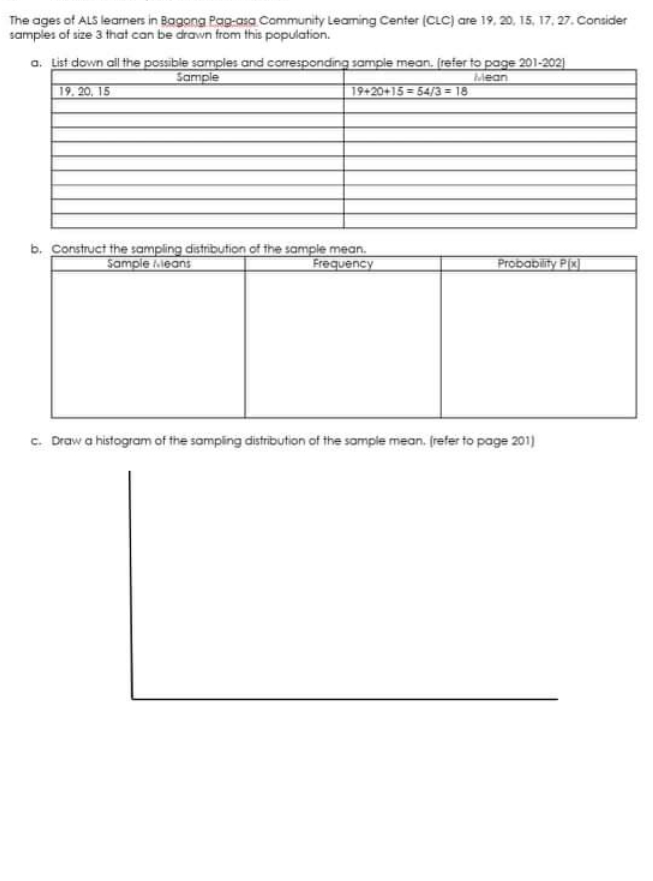
please answer 1st summative in statistics and probability in math grade 11 The ages of ALS learners in Bagong Pap-asa Community Learning Center (CLC) are
please answer 1st summative in statistics and probability in math grade 11
Step by Step Solution
There are 3 Steps involved in it
Step: 1

Get Instant Access to Expert-Tailored Solutions
See step-by-step solutions with expert insights and AI powered tools for academic success
Step: 2

Step: 3
Ace Your Homework with AI
Get the answers you need in no time with our AI-driven, step-by-step assistance
Get Started
Algebra And Trigonometry, Enhanced
Authors: Cynthia Y Young
4th Edition
1119320860, 9781119320869