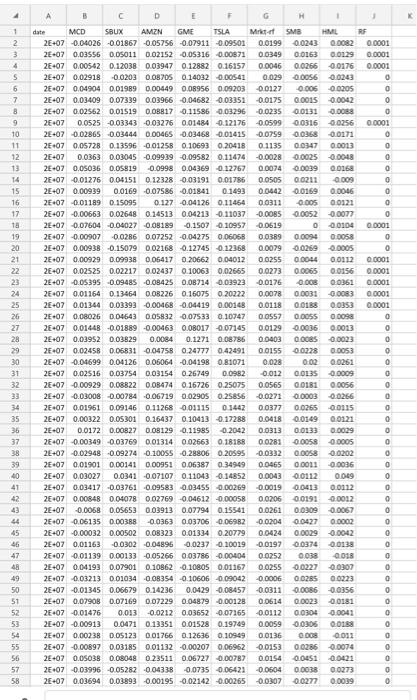
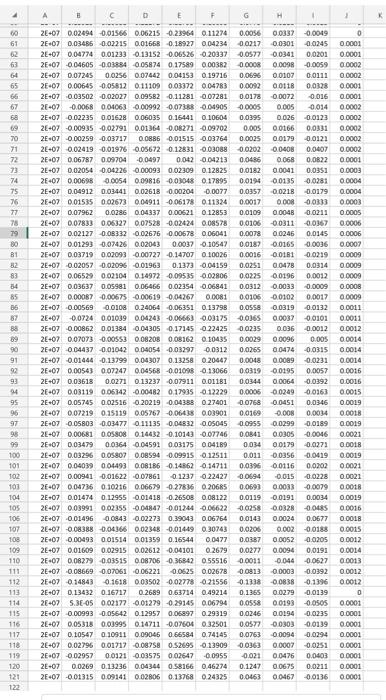
Please answer #3-5 in excel using the data attached in second picture. Please show all work. Thank you.

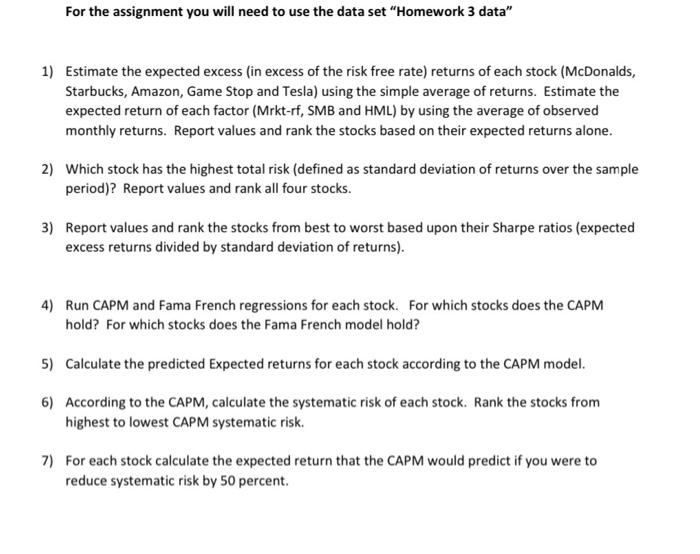
For the assignment you will need to use the data set "Homework 3 data" 1) Estimate the expected excess (in excess of the risk free rate) returns of each stock (McDonalds, Starbucks, Amazon, Game Stop and Tesla) using the simple average of returns. Estimate the expected return of each factor (Mrkt-rf, SMB and HML) by using the average of observed monthly returns. Report values and rank the stocks based on their expected returns alone. 2) Which stock has the highest total risk (defined as standard deviation of returns over the sample period)? Report values and rank all four stocks. 3) Report values and rank the stocks from best to worst based upon their Sharpe ratios (expected excess returns divided by standard deviation of returns). 4) Run CAPM and Fama French regressions for each stock. For which stocks does the CAPM hold? For which stocks does the Fama French model hold? 5) Calculate the predicted Expected returns for each stock according to the CAPM model. 6) According to the CAPM, calculate the systematic risk of each stock. Rank the stocks from highest to lowest CAPM systematic risk. 7) For each stock calculate the expected return that the CAPM would predict if you were to reduce systematic risk by 50 percent. iiiii..i....... i....iii For the assignment you will need to use the data set "Homework 3 data" 1) Estimate the expected excess (in excess of the risk free rate) returns of each stock (McDonalds, Starbucks, Amazon, Game Stop and Tesla) using the simple average of returns. Estimate the expected return of each factor (Mrkt-rf, SMB and HML) by using the average of observed monthly returns. Report values and rank the stocks based on their expected returns alone. 2) Which stock has the highest total risk (defined as standard deviation of returns over the sample period)? Report values and rank all four stocks. 3) Report values and rank the stocks from best to worst based upon their Sharpe ratios (expected excess returns divided by standard deviation of returns). 4) Run CAPM and Fama French regressions for each stock. For which stocks does the CAPM hold? For which stocks does the Fama French model hold? 5) Calculate the predicted Expected returns for each stock according to the CAPM model. 6) According to the CAPM, calculate the systematic risk of each stock. Rank the stocks from highest to lowest CAPM systematic risk. 7) For each stock calculate the expected return that the CAPM would predict if you were to reduce systematic risk by 50 percent. iiiii..i


