

Answered step by step
Verified Expert Solution
Question
1 Approved Answer
please answer 4-7!!! Requirements: Use the provided Financial Data (Excel fie) for Coke and Pepsi to complete the following analysis: 1. Calculate the current ratio
please answer 4-7!!! 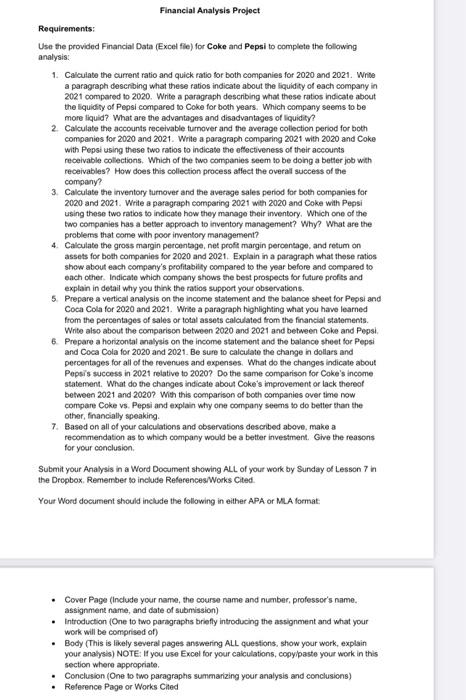
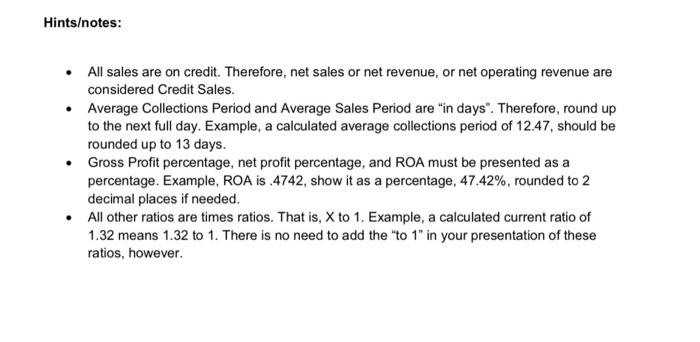

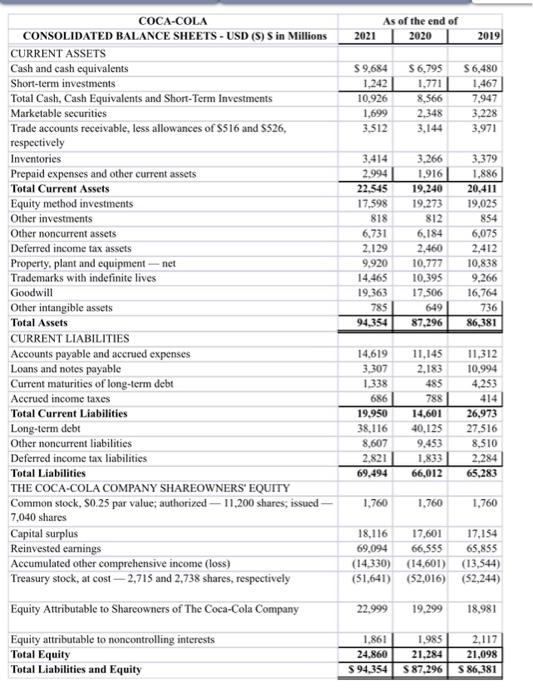
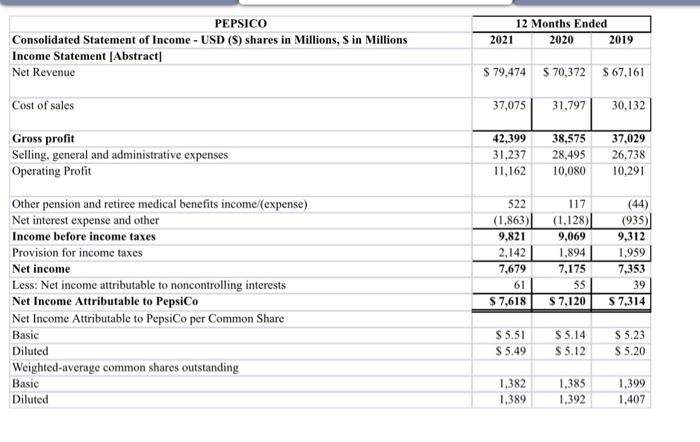
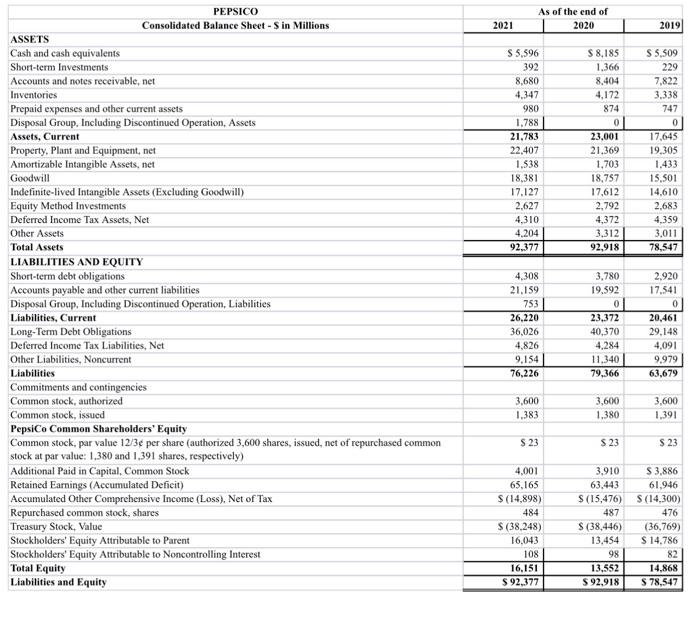
Requirements: Use the provided Financial Data (Excel fie) for Coke and Pepsi to complete the following analysis: 1. Calculate the current ratio and quick ratio for both companies for 2020 and 2021 . Write a paragraph describing what these ratios indicate about the liquidity of each company in 2021 compared to 2020. Write a paragraph describing what these ratios indicate about the liquidity of Pepsi compared to Coke for both years. Which company seems to be more liquid? What are the advantayes and disadvantages of liquidity? 2. Calculate the accounts receivable turnover and the awerage collection penod for both companies for 2020 and 2021 . Write a paragraph comparing 2021 with 2020 and Coke with Pepsi using these two ratios to indicate the eflectiveness of their accounts receivable collections. Which of the two companies seem to be doing a betler job with receivables? How does this collection process affect the overal success of the company? 3. Calculate the inventory fumover and the average sales period for both companies for 2020 and 2021. Write a paragraph comparing 2021 with 2020 and Coke with Pepsi using these two ratios to indicate how they manage their inwentory. Which one of the two companies has a better approach to inventory management? Why? What are the problems that come with poor inventory management? 4. Calculate the gross margin percentage, net prof margin peroentage, and retum on assets for both companies for 2020 and 2021. Explain in a paragraph what these ratios shew about each company's profitabilty compared to the year before and compared to each other. Indicate which company shows the best prospects for future profist and explain in detail why you think the ratios support your observations. 5. Prepare a vertical analysis on the income statement and the balance sheet for Pepsi and Coca Cola for 2020 and 2021 . Write a paragraph highlighting what you have learned from the percentages of sales or total assets calculated trom the financial stavements. Wrte also about the comparison between 2020 and 2021 and between Coke and Pepsi. 6. Prepare a horizontal analysis on the income statement and the balance sheet for Pepsi and Coca Cola for 2020 and 2021. Be sure to calculate the change in dollars and percentages for all of the revenues and expenses. What do the changes indicate about Pepsis success in 2021 relative to 2020? Do the same comparison for Coke's income statement. What do the changes indicate about Coke's improvement or lack thereot between 2021 and 2020? Wit this comparison of both companies over time now compare Coke vs. Pepsi and explain why one company seems to do better than the other, financially speakirg. 7. Based on all of your calculations and observations described above, make a recommendation as to which company would be a better investment. Give the reasons for your conclusion. Submit your Analysis in a Word Document showing ALL of your work by Sunday of Lesson 7 in the Dropbox. Remember to include References/Works Cited Your Word document should include the following in either APA or MLA format: - Cover Page (include your name, the course name and number, professor's name. assignment name, and date of sutomission) - Introduction (One to two paragraphs briefly introducing the assignment and what your work will be comprised of) - Body (This is likely several pages answering ALL questions, show your work, explain your analysis) NOTE: If you use Excel for your calculations, copyipaste your work in this section where appropriate. - Conclusion (One to two paragraphs summarizing your analysis and conclusions) - Reference Page or Works Cied Hintsotes: - All sales are on credit. Therefore, net sales or net revenue, or net operating revenue are considered Credit Sales. - Average Collections Period and Average Sales Period are "in days". Therefore, round up to the next full day. Example, a calculated average collections period of 12.47 , should be rounded up to 13 days. - Gross Profit percentage, net profit percentage, and ROA must be presented as a percentage. Example, ROA is .4742, show it as a percentage, 47.42\%, rounded to 2 decimal places if needed. - All other ratios are times ratios. That is, X to 1. Example, a calculated current ratio of 1.32 means 1.32 to 1 . There is no need to add the "to 1 " in your presentation of these ratios, however. Pepsi Balance Sheet Pepsi Income Statement Coca-Cola Balance COCA-COLA As of the end of CONSOLIDATED BALANCE SHEETS - USD (S) S in Millions \begin{tabular}{l|l|l|} \hline 2021 & 2020 & 2019 \\ \hline \end{tabular} CURRENT ASSETS Cash and cash equivalents Short-term investments Total Cash, Cash Equivalents and Short-Term Investments Marketable securities Trade accounts receivable, less allowances of $516 and $526, \begin{tabular}{|r|r|r|} \hline$9,684 & $6,795 & $6,480 \\ \hline 1,242 & 1,771 & 1,467 \\ \hline 10,926 & 8,566 & 7,947 \\ \hline 1,699 & 2,348 & 3,228 \\ \hline 3,512 & 3,144 & 3,971 \\ \hline \end{tabular} respectively Inventories Prepaid expenses and other current assets Total Current Assets Equity method investments Other investments Other noncurrent assets Deferred income tax assets Property, plant and equipment - net Trademarks with indefinite lives Goodwill Other intangible assets Total Assets \begin{tabular}{|r|r|r|} \hline 3,414 & 3,266 & 3,379 \\ \hline 2,994 & 1,916 & 1,886 \\ \hline 22,545 & 19,240 & 20,411 \\ \hline 17,598 & 19,273 & 19,025 \\ \hline 818 & 812 & 854 \\ \hline 6,731 & 6,184 & 6,075 \\ \hline 2,129 & 2,460 & 2,412 \\ \hline 9,920 & 10,777 & 10,838 \\ \hline 14,465 & 10,395 & 9,266 \\ \hline 19,363 & 17,506 & 16,764 \\ \hline 785 & 649 & 736 \\ \hline 94,354 & 87,296 & 86,381 \\ \hline \hline \end{tabular} CURRENT LIABILITIES Accounts payable and acerued expenses Loans and notes payable Current maturities of long-term debt Accrued income taxes Total Current Liabilities Long-term debt Other noncurrent liabilities Deferred income tax liabilities Total Liabilities THE COCA-COLA COMPANY SHAREOWNERS' EQUTTY \begin{tabular}{|l|l|l|l} Common stock, S0.25 par valuc; authorized 11,200 shares; issued - & 1,760 & 1,760 & 1,760 \end{tabular} 7,040 shares \begin{tabular}{|l|r|r|r|} \hline Capital surplus & 18,116 & 17,601 & 17,154 \\ \hline Reinvested earnings & 69,094 & 66,555 & 65,855 \\ \hline Accumulated other comprehensive income (loss) & (14,330) & (14,601) & (13,544) \\ \hline Treasury stock, at cost 2,715 and 2,738 shares, respectively & (51,641) & (52,016) & (52,244) \\ \hline Equity Attributable to Shareowners of The Coca-Cola Company & 22,999 & 19,299 & 18,981 \\ \hline Equity attributable to noncontrolling interests & & & \\ \hline Total Equity & 1,861 & 1,985 & 2,117 \\ \hline Total Liabilities and Equity & 24,860 & 21,284 & 21,098 \\ \hline \end{tabular} PEPSICO Consolidated Statement of Income - USD (\$) shares in Millions, $ in Millions Income Statement [Abstract] Net Revenue Cost of sales Gross profit Selling, general and administrative expenses Operating Profit \begin{tabular}{|c|c|c|} \hline \multicolumn{3}{|c|}{12 Months Ended } \\ \hline 2021 & 2020 & 2019 \\ \hline$79,474 & $70,372 & $67,161 \\ \hline 37,075 & 31,797 & 30,132 \\ \hline 42,399 & 38,575 & 37,029 \\ \hline 31,237 & 28,495 & 26,738 \\ \hline 11,162 & 10,080 & 10,291 \\ \hline \end{tabular} \begin{tabular}{|l|r|r|r|r|} \hline Other pension and retiree medical benefits income/(expense) & 522 & 117 & (44) \\ \hline Net interest expense and other & (1,863) & (1,128) & (935) \\ \hline Income before income taxes & 9,821 & 9,069 & 9,312 \\ \hline Provision for income taxes & 2,142 & 1,894 & 1,959 \\ \hline Net income & 7,679 & 7,175 & 7,353 \\ \hline Less: Net income attributable to noncontrolling interests & 61 & 55 & 39 \\ \hline Net Income Attributable to PepsiCo & $7,618 & $7,120 & $7,314 \\ \hline Net Income Attributable to PepsiCo per Common Share & & \\ \hline Basic & $5.51 & $5.14 & $5.23 \\ \hline Diluted & $5,49 & $5.12 & $5.20 \\ \hline Weighted-average common shares outstanding & & 1,382 & 1,385 & 1,399 \\ \hline Basic & 1,389 & 1,392 & 1,407 \\ \hline Diluted & & \\ \hline \end{tabular} Step by Step Solution
There are 3 Steps involved in it
Step: 1

Get Instant Access to Expert-Tailored Solutions
See step-by-step solutions with expert insights and AI powered tools for academic success
Step: 2

Step: 3
Ace Your Homework with AI
Get the answers you need in no time with our AI-driven, step-by-step assistance
Get Started
Trends In Financial Decision Making
Authors: Cees Van Dam
1978 Edition
9020706926, 978-9020706925