
please answer a through d
please do part b
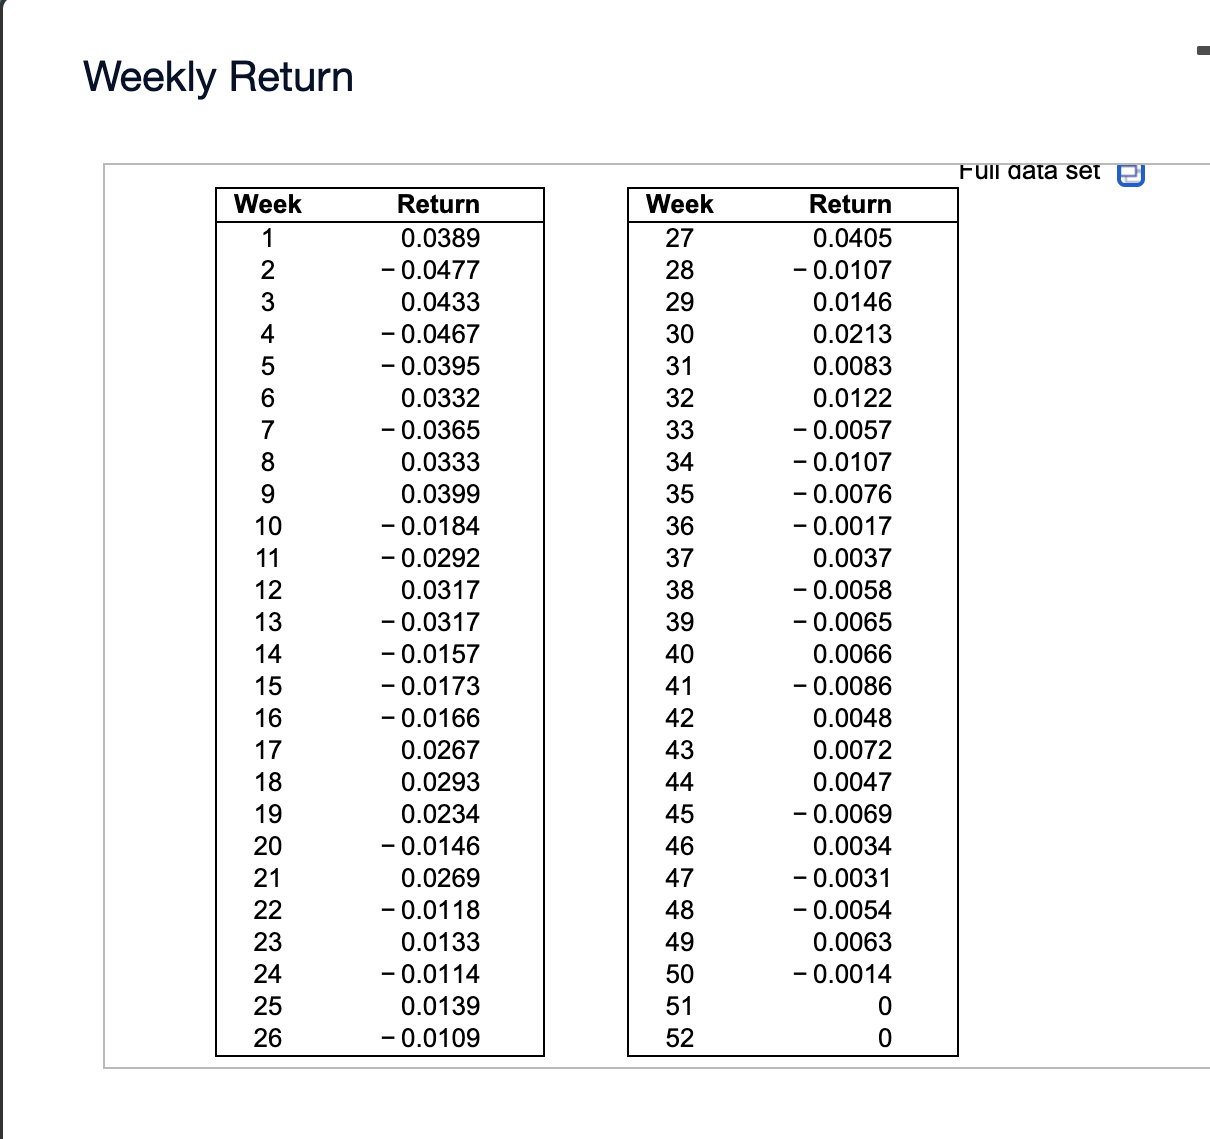
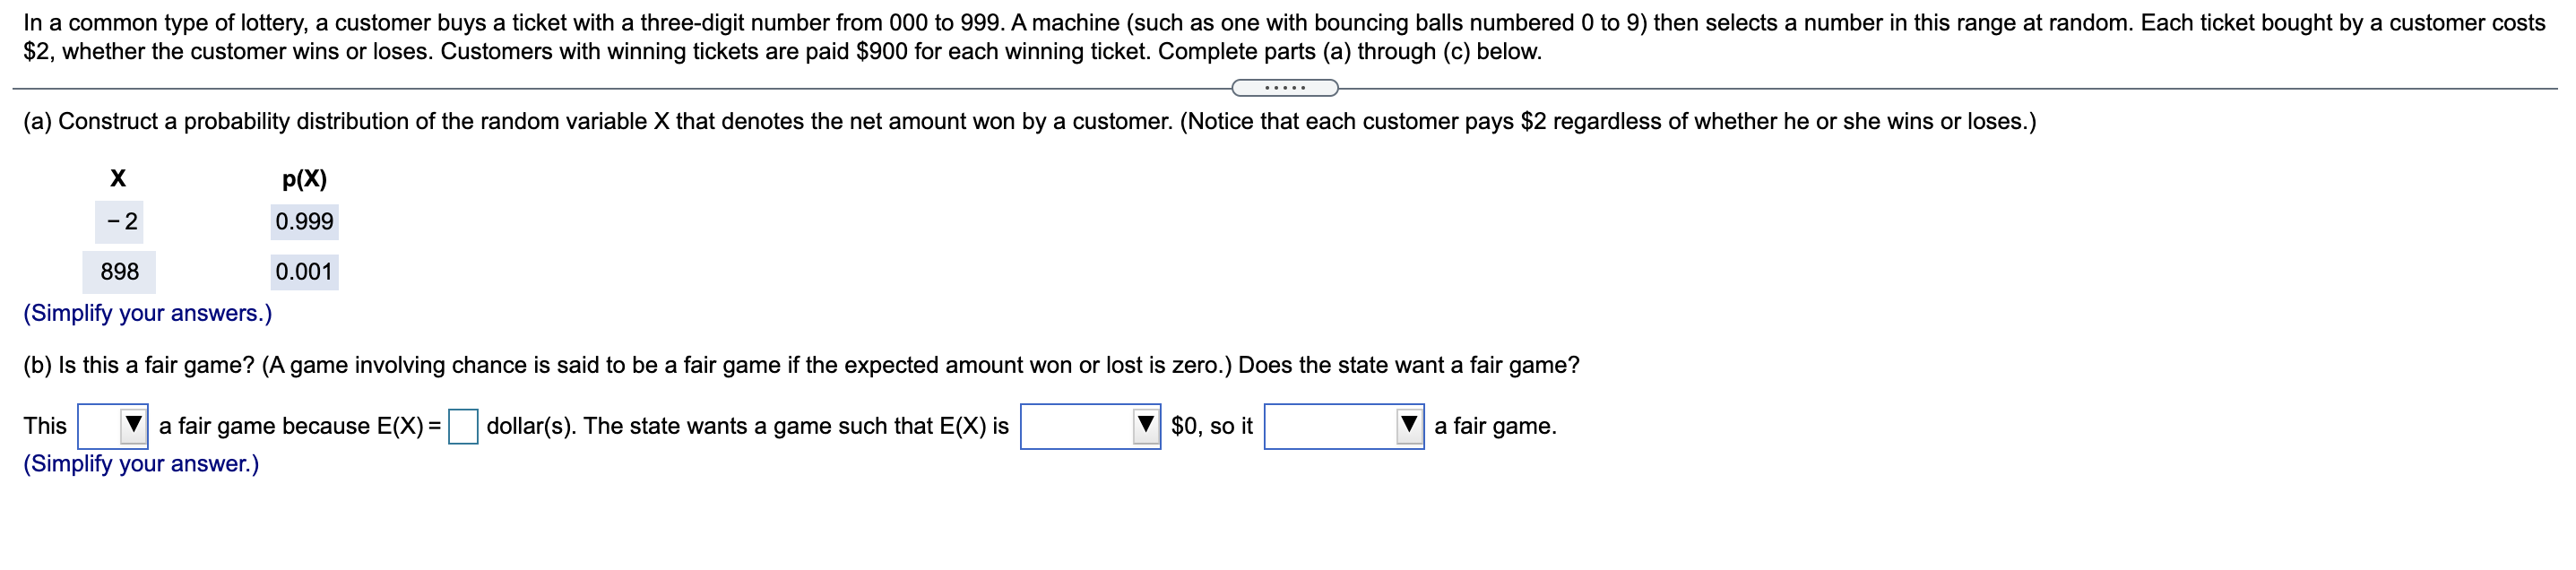
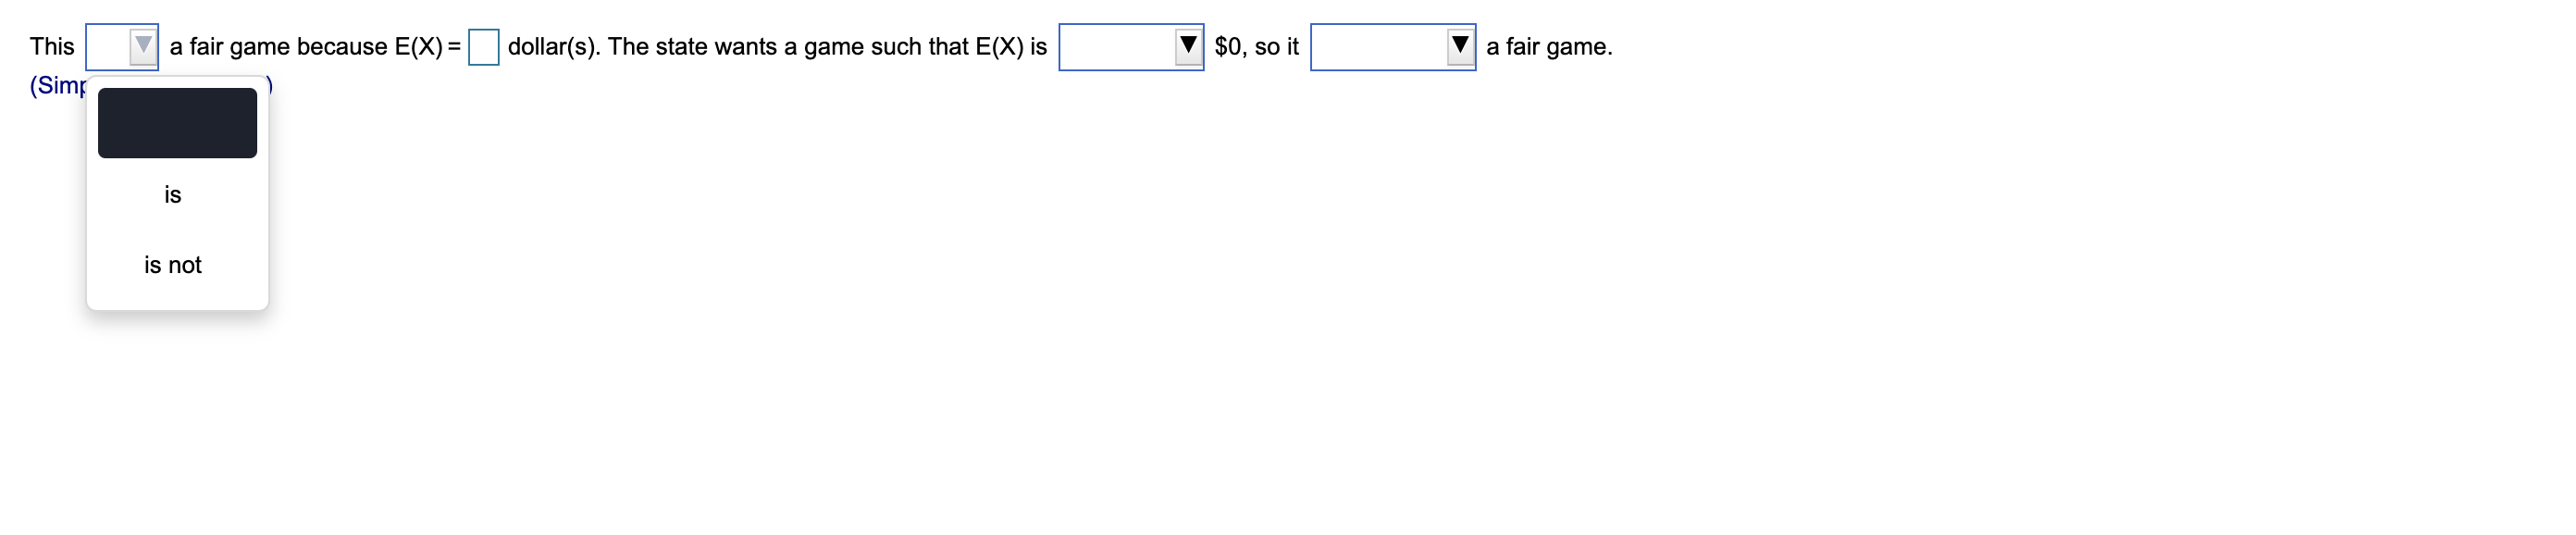
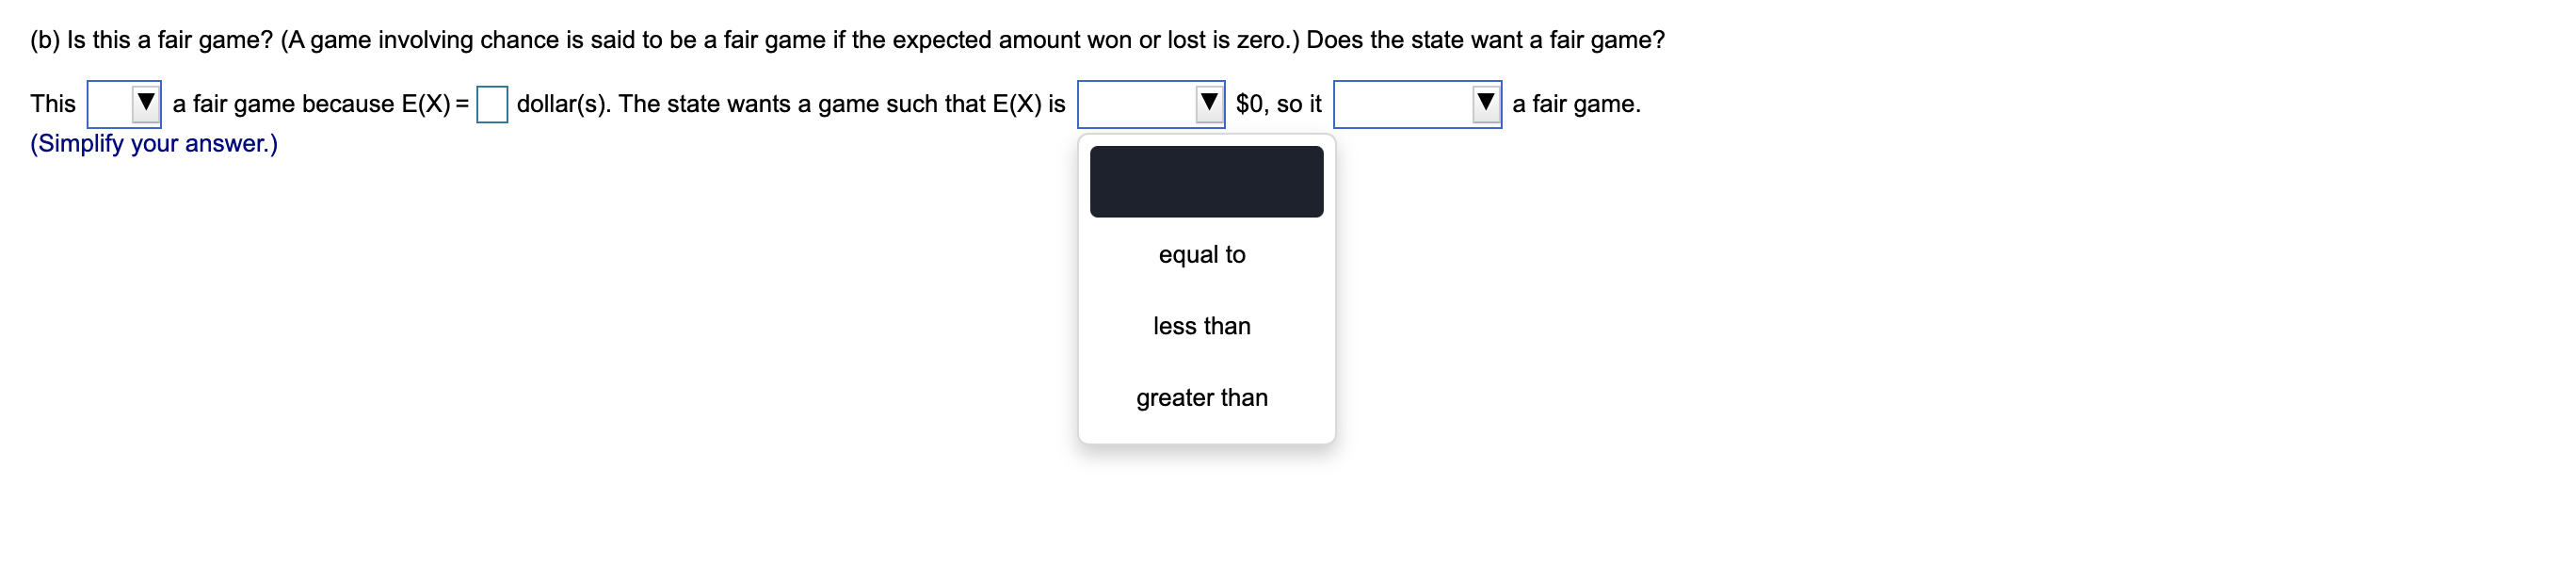
The accompanying data are weekly percentage changes for stock A. Use these data to compute the Sharpe ratio for the company. Complete parts (a) through (e) below. a Click the icon to view the data table. (a) Describe the shape and any key features of the frequency histogram of weekly percent change. Choose the correct graph below. A. B. c. D. 'Q Q Q Q E 0' 9' 9' 9' -6 0 6'3' -6 o 6 L)" -6 o 6 E)" -6 o 6 '2" Percent change Percent change Percent change 7 Percent change Choose the correct answer below. A. The histogram is skewed left with most of the returns clustered around 5%. I" B. The histogram is approximately normal and centered around 0%. C. The histogram is skewed right with most of the returns clustered around - 5%. D. The histogram has no underlying shape. (b) Find the mean and standard deviation of the percentage changes. Use the properties of the data to dene a random variable that is the percentage change in the stock for a future day. LetA represent the random variable that is the percentage change in stock A. E(A) = % SD(A) = % (Round to four decimal places as needed.) Weekly Return Full data set Week Return Week Return 0.0389 27 0.0405 - 0.0477 28 - 0.0107 0.0433 29 0.0146 - 0.0467 30 0.0213 - 0.0395 31 0.0083 JO O VOUIA WN . 0.0332 32 0.0122 - 0.0365 33 - 0.0057 0.0333 34 0.0107 0.0399 35 - 0.0076 - 0.0184 36 - 0.0017 11 - 0.0292 37 0.0037 12 0.0317 38 - 0.0058 13 - 0.0317 39 - 0.0065 14 - 0.0157 40 0.0066 15 - 0.0173 41 - 0.0086 16 - 0.0166 42 0.0048 17 0.0267 43 0.0072 18 0.0293 44 0.0047 19 0.0234 45 - 0.0069 20 - 0.0146 46 0.0034 21 0.0269 47 - 0.0031 22 - 0.0118 48 - 0.0054 23 0.0133 49 0.0063 24 - 0.0114 50 - 0.0014 25 0.0139 51 OO 26 - 0.0109 52in a common type of lottery, a customer buys a ticket with a threedigit number from 000 to 999. A machine (such as one with bouncing balls numbered 0 to 9) then selects a number in this range at random. Each ticket bought by a customer costs $2, whether the customer wins or loses. Customers with winning tickets are paid $900 for each winning ticket. Complete parts (a) through (c) below. (a) Construct a probability distribution of the random variable X that denotes the net amount won by a customer. (Notice that each customer pays $2 regardless of whether he or she wins or loses.) X P00 - 2 0.999 898 0.001 (Simplify your answers.) (b) Is this a fair game? (A game involving chance is said to be a fair game if the expected amount won or lost is zero.) Does the state want a fair game? This : a fair game because E(X) = dollar(s). The state wants a game such that E(X) is V $0, so it V a fair game. (Simplify your answer.) This V a fair game because E(X) = is is not dollar(s). The state wants a game such that E(X) is $0, so it a fair game. (b) Is this a fair game? (A game involving chance is said to be a fair game if the expected amount won or lost is zero.) Does the state want a fair game? This V a fair game because E(X) = dollar(s). The state wants a game such that E(X) is l $0, so it i a fair game. (Simplify your answen) - equal to less than greater than E(X) = dollar(s). The state wants a game such that E(X) is $0, so it a fair game. does not want wants


