Please answer above question using details given below. My Company Name is Sweets of Oman SAOG.
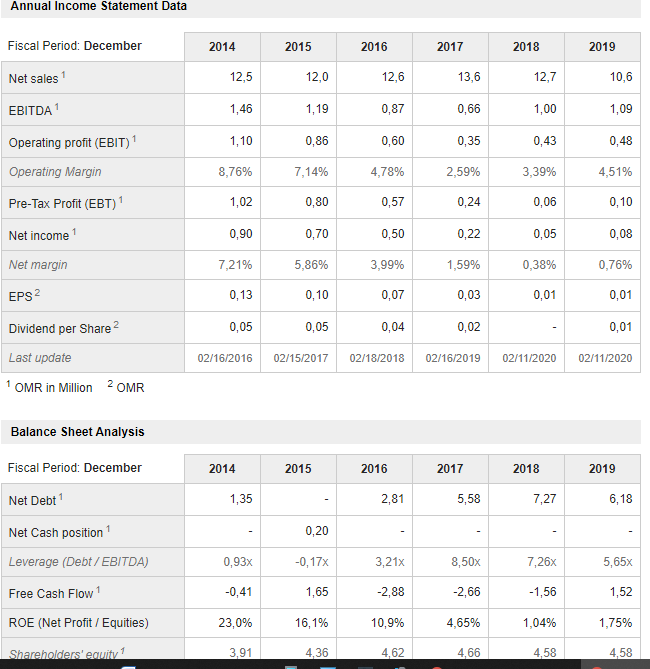
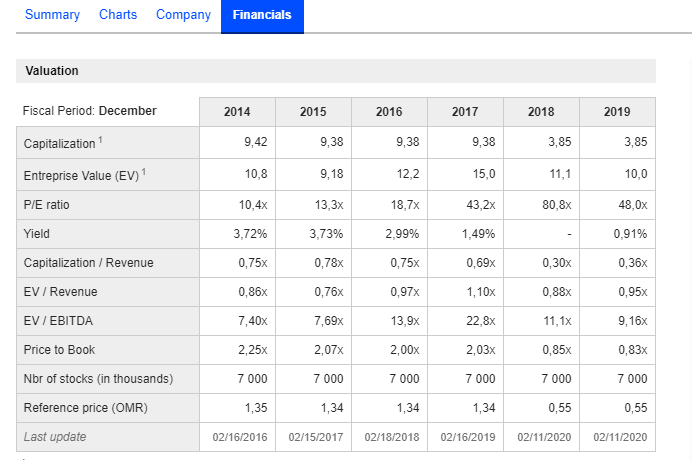
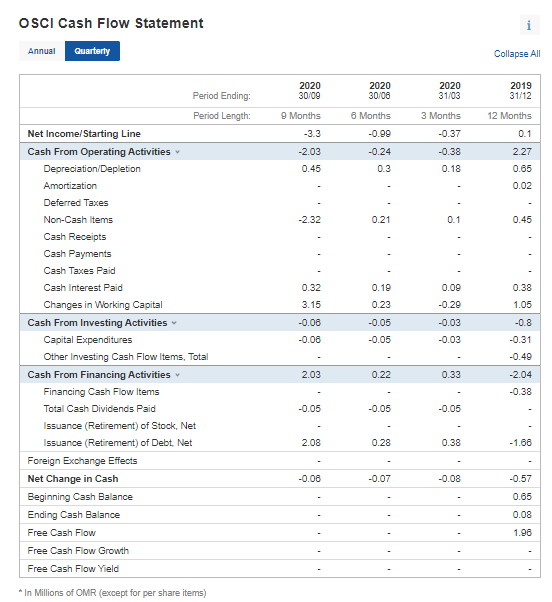
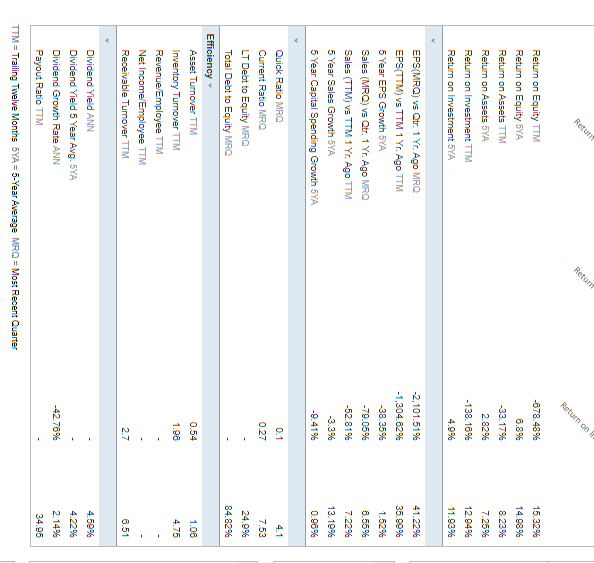
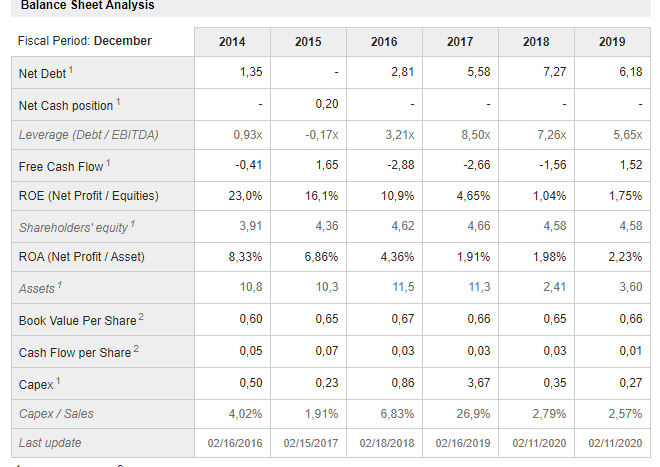
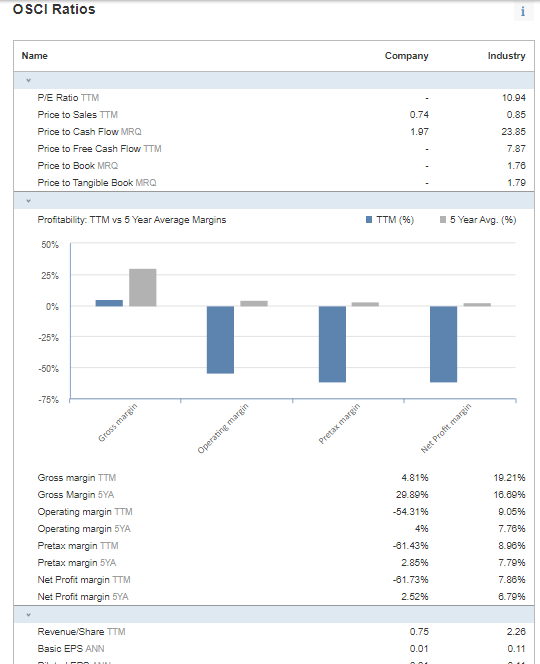
3. Environment Factors: a. Macro-economic Factors of the country: Economic Growth, Unemployment Rate, GDP etc. for the last year. b. Economic Sector Analysis of the company and its main competitors. Annual Income Statement Data Fiscal Period: December 2014 2015 2016 2017 2018 2019 12,5 12,0 12,6 13,6 12,7 10.6 Net sales EBITDA1 1,46 1,19 0,87 0,66 1,00 1,09 Operating profit (EBIT) 1 1,10 0,86 0,60 0,35 0,43 0,48 8,76% 7,14% 4,78% 2,59% 3,39% 4,51% Operating Margin Pre-Tax Profit (EBT) 1 1,02 0,80 0,57 0,24 0,06 0,10 Net income 0,90 0,70 0,50 0,22 0,05 0,08 Net margin 7,21% 5,86% 3,99% 1,59% 0,38% 0,76% EPS 2 0,13 0,10 0,07 0,03 0,01 0,01 Dividend per Share 2 0,05 0,05 0,04 0,02 0,01 02/16/2016 02/15/2017 02/18/2018 02/16/2019 02/11/2020 02/11/2020 Last update 1 OMR in Million 2 OMR Balance Sheet Analysis Fiscal Period: December 2014 2015 2016 2017 2018 2019 Net Debt 1,35 2,81 5,58 7,27 6,18 Net Cash position 0,20 Leverage (Debt / EBITDA) 0,93x -0,17x 3,21x 8,50x 7,26x 5,65x Free Cash Flow 1 -0,41 1,65 -2,88 -2,66 -1,56 1,52 ROE (Net Profit / Equities) 23,0% 16,1% 10,9% 4,65% 1,04% 1,75% Shareholders' equity 1 3.91 4,36 4,62 4,66 4,58 4,58 Summary Charts Company Financials Valuation Fiscal Period: December 2014 2015 2016 2017 2018 2019 9,42 9,38 9,38 9,38 3,85 3,85 Capitalization Entreprise Value (EV) P/E ratio 10,8 9,18 122 15,0 11,1 10,0 10,4x 13,3x 18,7% 43,2x 80,8x 48,0x Yield 3,72% 3,73% 2,99% 1,49% 0,91% Capitalization / Revenue 0,75x 0,78x 0,75x 0,69% 0,30x 0,36x EV / Revenue 0,86x 0,76x 0,97% 1,10x 0,88 0,95x EV / EBITDA 7,40x 7,69% 13,9% 22,8x 11,1x 9,16x 2,25x 2,07x 2,00x 2,03x 0,85x Price to Book Nbr of stocks (in thousands) Reference price (OMR) 0,83% 7 000 7 000 7000 7 000 7 000 7000 1,35 1,34 1,34 1,34 0,55 0,55 Last update 02/16/2016 02/15/2017 02/18/2018 02/16/2019 02/11/2020 02/11/2020 OSCI Cash Flow Statement Annual Quarterly Collapse All 2020 30/09 2020 30/06 2020 31/03 2019 31/12 12 Months 9 Months -3.3 6 Months -0.99 3 Months -0.37 0.1 2.27 -2.03 0.45 -0.24 0.3 -0.38 0.18 0.65 0.02 -2.32 0.21 0.1 0.45 0.32 0.19 0.09 0.38 3.15 0.23 -0.29 1.05 -0.05 Period Ending Period Length: Net Income/Starting Line Cash From Operating Activities Depreciation/Depletion Amortization Deferred Taxes Non-Cash Items Cash Receipts Cash Payments Cash Taxes Paid Cash Interest Paid Changes in Working Capital Cash From Investing Activities Capital Expenditures Other Investing Cash Flow Items, Total Cash From Financing Activities Financing Cash Flow Items Total Cash Dividends Paid Issuance (Retirement) of Stock, Net Issuance (Retirement) of Debt. Net Foreign Exchange Effects Net Change in Cash Beginning Cash Balance Ending Cash Balance Free Cash Flow Free Cash Flow Growth Free Cash Flow Yield -0.08 -0.00 -0.03 -0.03 -0.05 -0.8 -0.31 -0.49 2.03 0.22 0.33 -2.04 -0.38 -0.05 -0.05 -0.05 2.08 0.28 0.38 -1.68 -0.00 -0.07 -0.08 -0.57 0.65 0.08 1.96 In Millions of OMR (except for per share items) Retur Retund Return on -678.48% 15.32% 14.98% 8.23% Return on Equity TTM Return on Equity 5YA Return on Assets TTM Return on Assets 5YA Return on Investment TTM Return on Investment 5YA 6.8% -33.17% 2.82% -138.16% 4.9% 7.2596 12.94% 11.63% 41.22% 35.99% 1.529% EPS(MRO) vs Otr. 1 Yr. Ago MRQ EPS(TTM) vs TTM 1 Yr. Ago TTM 5 Year EPS Growth 5YA Sales (MRQ) vs Qtr. 1 Yr Ago MRQ Sales (TTM) vs TTM 1 Yr. Ago TTM 5 Year Sales Growth 5YA 5 Year Capital Spending Growth SYA -2,101.51% -1,304.629 -38.35% -79.05% -52.81% -3.3% 6.55% 7.2296 13. 19% -9.41 0.96% 4.1 0.1 0.27 7.53 24.9% 84.82% Quick Ratio MRQ Current Ratio MRO LT Debt to Equity MRQ Total Debt to Equity MRO Efficiency Asset Turnover TTM Inventory Tumover TTM Revenue/Employee TTM Net Income/Employee TTM Receivable Turnover TTM 0.54 1.08 4.75 1.96 27 6.51 4.59% 4.22% 2.14% -42.76% Dividend Yield ANN Dividend Yield 5 Year Avg. 5YA Dividend Growth Rate ANN Payout Ratio ITM TTM = Trailing Twelve Months 5YA = 5-Year Average MRQ = Most Recent Quarter 34.95 Balance Sheet Analysis Fiscal Period: December 2014 2015 2016 2017 2018 2019 Net Debt 1,35 2.81 5,58 7,27 6,18 Net Cash position 0,20 Leverage (Debt / EBITDA) 0,93x -0,17% 3,21x 8,50x 7,26% 5,65x Free Cash Flow -0,41 1,65 -2,88 -2,66 -1,56 1,52 ROE (Net Profit / Equities) 23,0% 16,1% 10,9% 4,65% 1,04% 1,75% Shareholders' equity 3,91 4,36 4,62 4,66 4,58 4,58 ROA (Net Profit / Asset) 8,33% 6,86% 4,36% 1,91% 1,98% 2.23% Assets 10,8 10,3 11,5 11,3 2,41 3,60 Book Value Per Share 2 0,60 0,65 0,67 0,66 0,65 0,66 Cash Flow per Share 2 0,05 0,07 0,03 0,03 0,03 0,01 Capex 1 0,50 0,23 0,86 3,67 0,35 0,27 Capex / Sales 4,02% 1,91% 6,83% 26,9% 2,79% 2,57% Last update 02/16/2016 02/15/2017 02/18/2018 02/16/2019 02/11/2020 02/11/2020 OSCI Ratios Name Company Industry 10.94 0.85 0.74 1.97 PE Ratio TTM Price to Sales TTM Price to Cash Flow MRQ Price to Free Cash Flow TTM Price to Book MRO Price to Tangible Book MRQ 23.85 7.87 1.78 1.79 Profitability. TTM vs 5 Year Average Margins TTM (96) 15 Year Avg. (%) 50% 25% 0% -25% -50% -75% Gross margin Pretax margin Operating margin Net Profit margin 19.21% 18.09% 9.05% 7.78% Gross margin TTM Gross Margin SYA Operating margin TTM Operating margin 5YA Pretax margin TTM Pretax margin 5YA Net Profit margin TTM Net Profit margin 5YA 4.81% 29.899 -54.31% 4% -81.43% 2.85% -81.73% 2.52% 8.96% 7.79% 7.86% 8.79% 0.75 2.26 Revenue/Share TTM Basic EPS ANN 0.01 0.11 3. Environment Factors: a. Macro-economic Factors of the country: Economic Growth, Unemployment Rate, GDP etc. for the last year. b. Economic Sector Analysis of the company and its main competitors. Annual Income Statement Data Fiscal Period: December 2014 2015 2016 2017 2018 2019 12,5 12,0 12,6 13,6 12,7 10.6 Net sales EBITDA1 1,46 1,19 0,87 0,66 1,00 1,09 Operating profit (EBIT) 1 1,10 0,86 0,60 0,35 0,43 0,48 8,76% 7,14% 4,78% 2,59% 3,39% 4,51% Operating Margin Pre-Tax Profit (EBT) 1 1,02 0,80 0,57 0,24 0,06 0,10 Net income 0,90 0,70 0,50 0,22 0,05 0,08 Net margin 7,21% 5,86% 3,99% 1,59% 0,38% 0,76% EPS 2 0,13 0,10 0,07 0,03 0,01 0,01 Dividend per Share 2 0,05 0,05 0,04 0,02 0,01 02/16/2016 02/15/2017 02/18/2018 02/16/2019 02/11/2020 02/11/2020 Last update 1 OMR in Million 2 OMR Balance Sheet Analysis Fiscal Period: December 2014 2015 2016 2017 2018 2019 Net Debt 1,35 2,81 5,58 7,27 6,18 Net Cash position 0,20 Leverage (Debt / EBITDA) 0,93x -0,17x 3,21x 8,50x 7,26x 5,65x Free Cash Flow 1 -0,41 1,65 -2,88 -2,66 -1,56 1,52 ROE (Net Profit / Equities) 23,0% 16,1% 10,9% 4,65% 1,04% 1,75% Shareholders' equity 1 3.91 4,36 4,62 4,66 4,58 4,58 Summary Charts Company Financials Valuation Fiscal Period: December 2014 2015 2016 2017 2018 2019 9,42 9,38 9,38 9,38 3,85 3,85 Capitalization Entreprise Value (EV) P/E ratio 10,8 9,18 122 15,0 11,1 10,0 10,4x 13,3x 18,7% 43,2x 80,8x 48,0x Yield 3,72% 3,73% 2,99% 1,49% 0,91% Capitalization / Revenue 0,75x 0,78x 0,75x 0,69% 0,30x 0,36x EV / Revenue 0,86x 0,76x 0,97% 1,10x 0,88 0,95x EV / EBITDA 7,40x 7,69% 13,9% 22,8x 11,1x 9,16x 2,25x 2,07x 2,00x 2,03x 0,85x Price to Book Nbr of stocks (in thousands) Reference price (OMR) 0,83% 7 000 7 000 7000 7 000 7 000 7000 1,35 1,34 1,34 1,34 0,55 0,55 Last update 02/16/2016 02/15/2017 02/18/2018 02/16/2019 02/11/2020 02/11/2020 OSCI Cash Flow Statement Annual Quarterly Collapse All 2020 30/09 2020 30/06 2020 31/03 2019 31/12 12 Months 9 Months -3.3 6 Months -0.99 3 Months -0.37 0.1 2.27 -2.03 0.45 -0.24 0.3 -0.38 0.18 0.65 0.02 -2.32 0.21 0.1 0.45 0.32 0.19 0.09 0.38 3.15 0.23 -0.29 1.05 -0.05 Period Ending Period Length: Net Income/Starting Line Cash From Operating Activities Depreciation/Depletion Amortization Deferred Taxes Non-Cash Items Cash Receipts Cash Payments Cash Taxes Paid Cash Interest Paid Changes in Working Capital Cash From Investing Activities Capital Expenditures Other Investing Cash Flow Items, Total Cash From Financing Activities Financing Cash Flow Items Total Cash Dividends Paid Issuance (Retirement) of Stock, Net Issuance (Retirement) of Debt. Net Foreign Exchange Effects Net Change in Cash Beginning Cash Balance Ending Cash Balance Free Cash Flow Free Cash Flow Growth Free Cash Flow Yield -0.08 -0.00 -0.03 -0.03 -0.05 -0.8 -0.31 -0.49 2.03 0.22 0.33 -2.04 -0.38 -0.05 -0.05 -0.05 2.08 0.28 0.38 -1.68 -0.00 -0.07 -0.08 -0.57 0.65 0.08 1.96 In Millions of OMR (except for per share items) Retur Retund Return on -678.48% 15.32% 14.98% 8.23% Return on Equity TTM Return on Equity 5YA Return on Assets TTM Return on Assets 5YA Return on Investment TTM Return on Investment 5YA 6.8% -33.17% 2.82% -138.16% 4.9% 7.2596 12.94% 11.63% 41.22% 35.99% 1.529% EPS(MRO) vs Otr. 1 Yr. Ago MRQ EPS(TTM) vs TTM 1 Yr. Ago TTM 5 Year EPS Growth 5YA Sales (MRQ) vs Qtr. 1 Yr Ago MRQ Sales (TTM) vs TTM 1 Yr. Ago TTM 5 Year Sales Growth 5YA 5 Year Capital Spending Growth SYA -2,101.51% -1,304.629 -38.35% -79.05% -52.81% -3.3% 6.55% 7.2296 13. 19% -9.41 0.96% 4.1 0.1 0.27 7.53 24.9% 84.82% Quick Ratio MRQ Current Ratio MRO LT Debt to Equity MRQ Total Debt to Equity MRO Efficiency Asset Turnover TTM Inventory Tumover TTM Revenue/Employee TTM Net Income/Employee TTM Receivable Turnover TTM 0.54 1.08 4.75 1.96 27 6.51 4.59% 4.22% 2.14% -42.76% Dividend Yield ANN Dividend Yield 5 Year Avg. 5YA Dividend Growth Rate ANN Payout Ratio ITM TTM = Trailing Twelve Months 5YA = 5-Year Average MRQ = Most Recent Quarter 34.95 Balance Sheet Analysis Fiscal Period: December 2014 2015 2016 2017 2018 2019 Net Debt 1,35 2.81 5,58 7,27 6,18 Net Cash position 0,20 Leverage (Debt / EBITDA) 0,93x -0,17% 3,21x 8,50x 7,26% 5,65x Free Cash Flow -0,41 1,65 -2,88 -2,66 -1,56 1,52 ROE (Net Profit / Equities) 23,0% 16,1% 10,9% 4,65% 1,04% 1,75% Shareholders' equity 3,91 4,36 4,62 4,66 4,58 4,58 ROA (Net Profit / Asset) 8,33% 6,86% 4,36% 1,91% 1,98% 2.23% Assets 10,8 10,3 11,5 11,3 2,41 3,60 Book Value Per Share 2 0,60 0,65 0,67 0,66 0,65 0,66 Cash Flow per Share 2 0,05 0,07 0,03 0,03 0,03 0,01 Capex 1 0,50 0,23 0,86 3,67 0,35 0,27 Capex / Sales 4,02% 1,91% 6,83% 26,9% 2,79% 2,57% Last update 02/16/2016 02/15/2017 02/18/2018 02/16/2019 02/11/2020 02/11/2020 OSCI Ratios Name Company Industry 10.94 0.85 0.74 1.97 PE Ratio TTM Price to Sales TTM Price to Cash Flow MRQ Price to Free Cash Flow TTM Price to Book MRO Price to Tangible Book MRQ 23.85 7.87 1.78 1.79 Profitability. TTM vs 5 Year Average Margins TTM (96) 15 Year Avg. (%) 50% 25% 0% -25% -50% -75% Gross margin Pretax margin Operating margin Net Profit margin 19.21% 18.09% 9.05% 7.78% Gross margin TTM Gross Margin SYA Operating margin TTM Operating margin 5YA Pretax margin TTM Pretax margin 5YA Net Profit margin TTM Net Profit margin 5YA 4.81% 29.899 -54.31% 4% -81.43% 2.85% -81.73% 2.52% 8.96% 7.79% 7.86% 8.79% 0.75 2.26 Revenue/Share TTM Basic EPS ANN 0.01 0.11