Please answer all 4, I am so desperate!! Thank you!
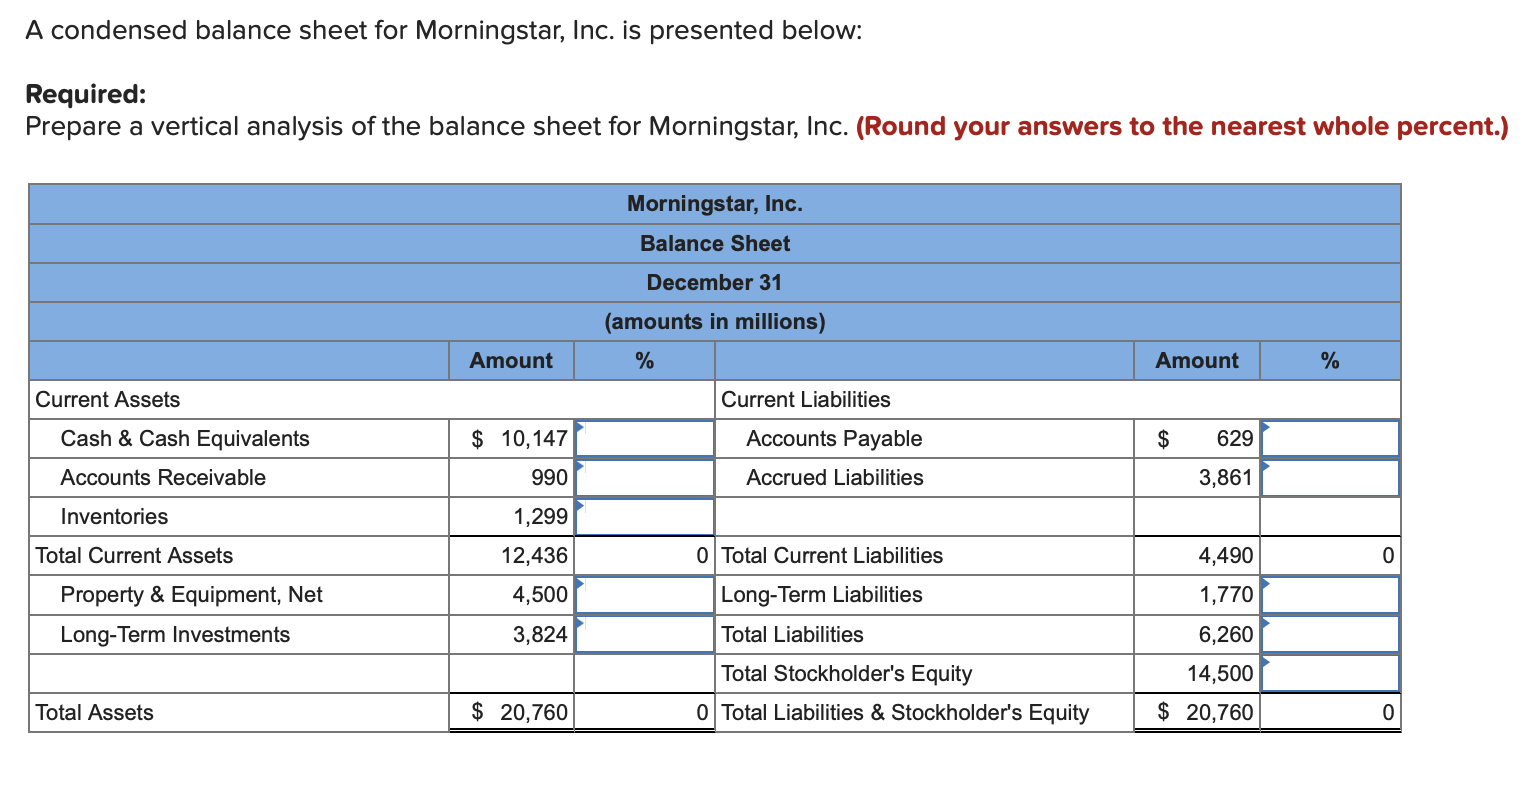
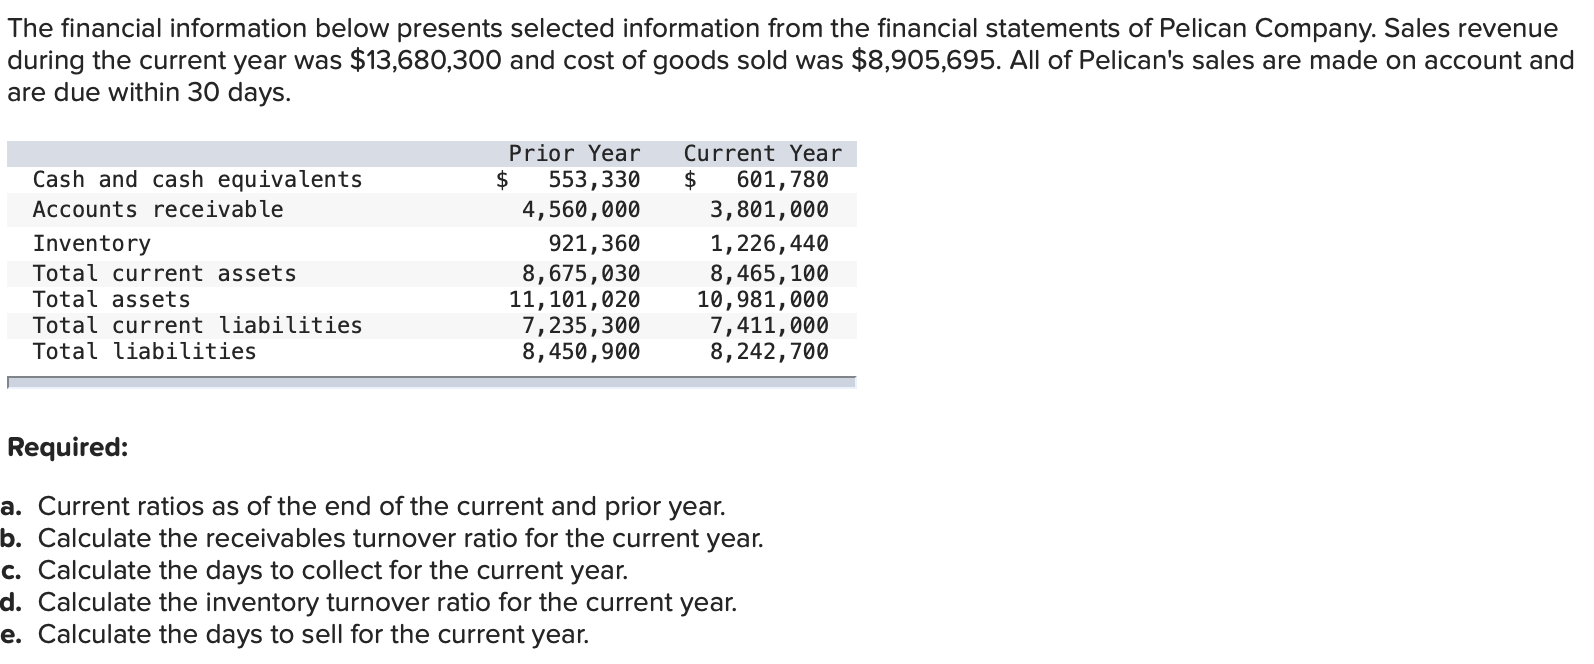
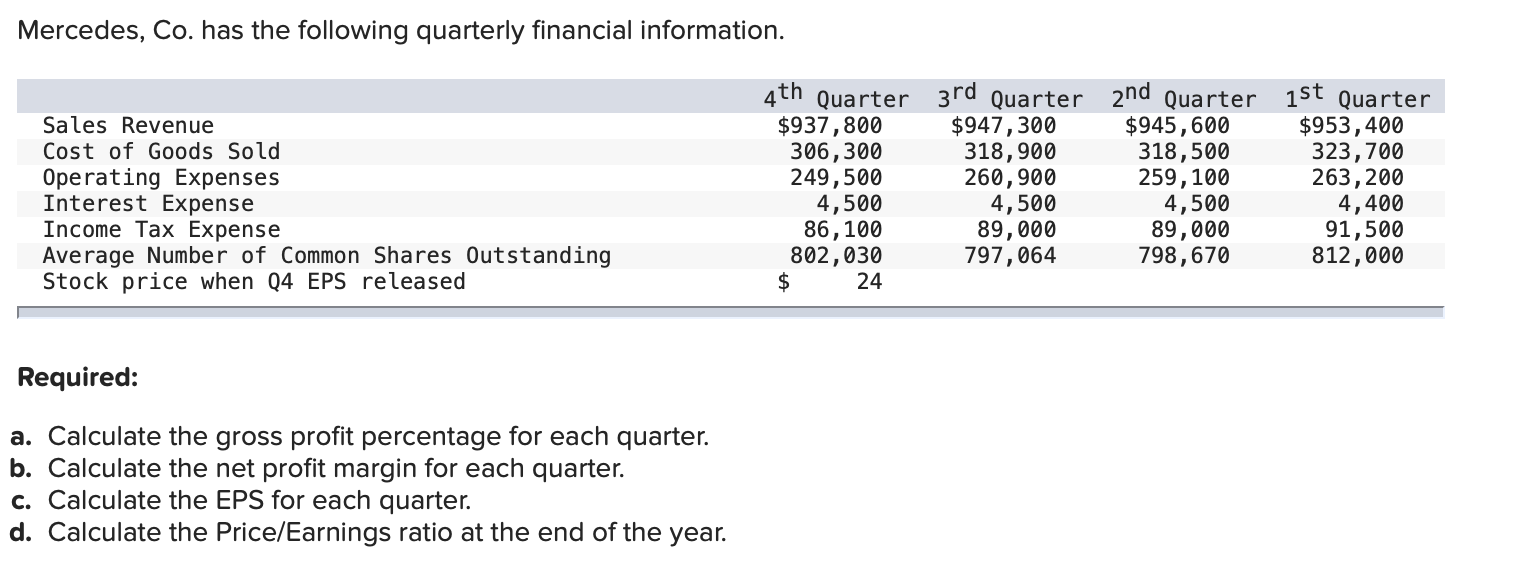
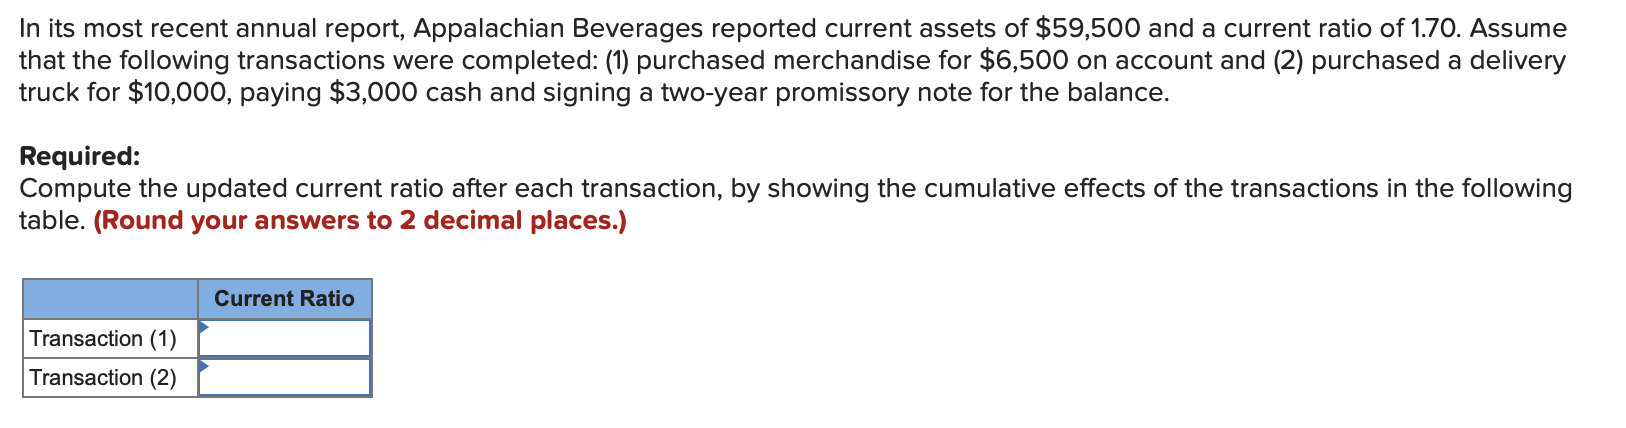
A condensed balance sheet for Morningstar, Inc. is presented below: Required: Prepare a vertical analysis of the balance sheet for Morningstar, Inc. (Round your answers to the nearest whole percent.) Morningstar, Inc. Balance Sheet December 31 (amounts in millions) Amount % Amount % Current Assets Current Liabilities $ 10,147 $ 629 Cash & Cash Equivalents Accounts Receivable Accounts Payable Accrued Liabilities 990 3,861 Inventories 1,299 Total Current Assets 0 Total Current Liabilities 0 12,436 4,500 3,824 4,490 1,770 Property & Equipment, Net Long-Term Investments Long-Term Liabilities Total Liabilities 6,260 Total Stockholder's Equity 0 Total Liabilities & Stockholder's Equity 14,500 $ 20,760 Total Assets $ 20,760 0 The financial information below presents selected information from the financial statements of Pelican Company. Sales revenue during the current year was $13,680,300 and cost of goods sold was $8,905,695. All of Pelican's sales are made on account and are due within 30 days. Cash and cash equivalents Accounts receivable Inventory Total current assets Total assets Total current liabilities Total liabilities Prior Year $ 553,330 4,560,000 921,360 8,675,030 11, 101,020 7,235,300 8,450,900 Current Year $ 601,780 3,801,000 1,226,440 8,465, 100 10,981,000 7,411,000 8,242,700 Required: a. Current ratios as of the end of the current and prior year. b. Calculate the receivables turnover ratio for the current year. c. Calculate the days to collect for the current year. d. Calculate the inventory turnover ratio for the current year. e. Calculate the days to sell for the current year. Mercedes, Co. has the following quarterly financial information. 4th Sales Revenue Cost of Goods Sold Operating Expenses Interest Expense Income Tax Expense Average Number of Common Shares Outstanding Stock price when Q4 EPS released Quarter 3rd Quarter 2nd Quarter 1st Quarter $937,800 $947, 300 $945,600 $953,400 306,300 318,900 318,500 323,700 249,500 260,900 259,100 263,200 4,500 4,500 4,500 4,400 86,100 89,000 89,000 91,500 802,030 797,064 798,670 812,000 $ 24 Required: a. Calculate the gross profit percentage for each quarter. b. Calculate the net profit margin for each quarter. c. Calculate the EPS for each quarter. d. Calculate the Price/Earnings ratio at the end of the year. In its most recent annual report, Appalachian Beverages reported current assets of $59,500 and a current ratio of 1.70. Assume that the following transactions were completed: (1) purchased merchandise for $6,500 on account and (2) purchased a delivery truck for $10,000, paying $3,000 cash and signing a two-year promissory note for the balance. Required: Compute the updated current ratio after each transaction, by showing the cumulative effects of the transactions in the following table. (Round your answers to 2 decimal places.) Current Ratio Transaction (1) Transaction (2)