

Answered step by step
Verified Expert Solution
Question
1 Approved Answer
Please answer all in a MATLAB formation Problem 1: Left: A center pivot field viewed from above Right: A close-up of the irrigation machinery Many
Please answer all in a MATLAB formation
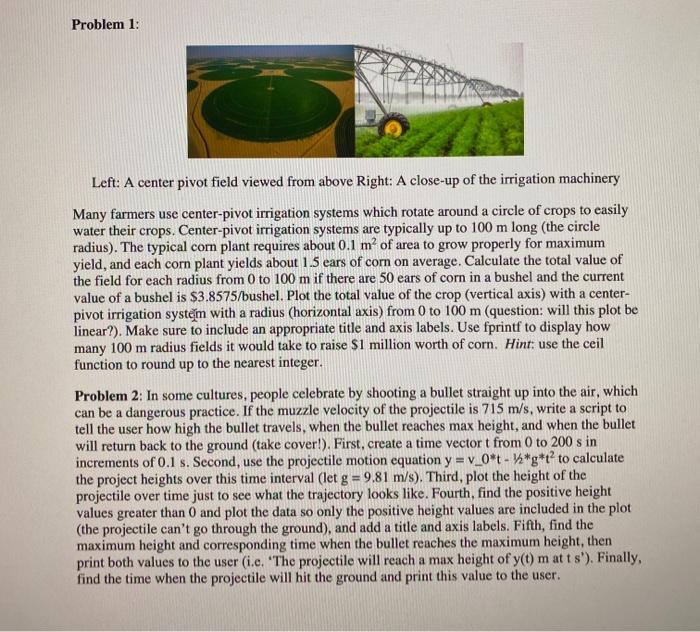
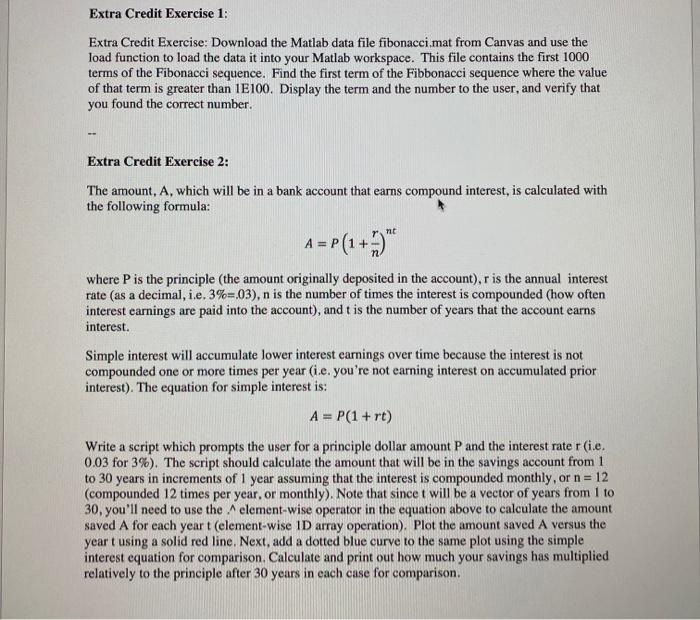
Problem 1: Left: A center pivot field viewed from above Right: A close-up of the irrigation machinery Many farmers use center-pivot irrigation systems which rotate around a circle of crops to easily water their crops. Center-pivot irrigation systems are typically up to 100 m long (the circle radius). The typical com plant requires about 0.1 m of area to grow properly for maximum yield, and each corn plant yields about 1.5 ears of corn on average. Calculate the total value of the field for each radius from 0 to 100 m if there are 50 ears of corn in a bushel and the current value of a bushel is $3.8575/bushel. Plot the total value of the crop (vertical axis) with a center- pivot irrigation system with a radius (horizontal axis) from 0 to 100 m (question: Will this plot be linear?). Make sure to include an appropriate title and axis labels. Use fprintf to display how many 100 m radius fields it would take to raise $1 million worth of corn. Hint: use the ceil function to round up to the nearest integer. Problem 2: In some cultures, people celebrate by shooting a bullet straight up into the air, which can be a dangerous practice. If the muzzle velocity of the projectile is 715 m/s, write a script to tell the user how high the bullet travels, when the bullet reaches max height, and when the bullet will return back to the ground (take cover!). First, create a time vector t from 0 to 200 s in increments of 0.1 s. Second, use the projectile motion equation y = v_0*t-y*g*tto calculate the project heights over this time interval (let g = 9.81 m/s). Third, plot the height of the projectile over time just to see what the trajectory looks like. Fourth, find the positive height values greater than 0 and plot the data so only the positive height values are included in the plot (the projectile can't go through the ground), and add a title and axis labels. Fifth, find the maximum height and corresponding time when the bullet reaches the maximum height, then print both values to the user i.e. "The projectile will reach a max height of y(t) matt s'). Finally, find the time when the projectile will hit the ground and print this value to the user. Extra Credit Exercise 1: Extra Credit Exercise: Download the Matlab data file fibonacci mat from Canvas and use the load function to load the data it into your Matlab workspace. This file contains the first 1000 terms of the Fibonacci sequence. Find the first term of the Fibbonacci sequence where the value of that term is greater than 1E100. Display the term and the number to the user, and verify that you found the correct number. Extra Credit Exercise 2: The amount, A, which will be in a bank account that earns compound interest, is calculated with the following formula: A = P(1+" where P is the principle (the amount originally deposited in the account).r is the annual interest rate (as a decimal, i.e.3%=.03), n is the number of times the interest is compounded (how often interest earnings are paid into the account), and t is the number of years that the account earns interest. Simple interest will accumulate lower interest earnings over time because the interest is not compounded one or more times per year (i.e. you're not earning interest on accumulated prior interest). The equation for simple interest is: A= P(1 + rt) Write a script which prompts the user for a principle dollar amount P and the interest rater (ie. 0.03 for 3%). The script should calculate the amount that will be in the savings account from 1 to 30 years in increments of 1 year assuming that the interest is compounded monthly, or n = 12 (compounded 12 times per year, or monthly). Note that sincet will be a vector of years from 1 to 30, you'll need to use the element-wise operator in the equation above to calculate the amount saved A for each yeart (element-wise ID array operation). Plot the amount saved A versus the yeart using a solid red line, Next, add a dotted blue curve to the same plot using the simple interest equation for comparison. Calculate and print out how much your savings has multiplied relatively to the principle after 30 years in each case for comparison Step by Step Solution
There are 3 Steps involved in it
Step: 1

Get Instant Access to Expert-Tailored Solutions
See step-by-step solutions with expert insights and AI powered tools for academic success
Step: 2

Step: 3
Ace Your Homework with AI
Get the answers you need in no time with our AI-driven, step-by-step assistance
Get Started
Database Design Application Development And Administration
Authors: Michael V. Mannino
3rd Edition
0071107010, 978-0071107013