Please answer all of the questions
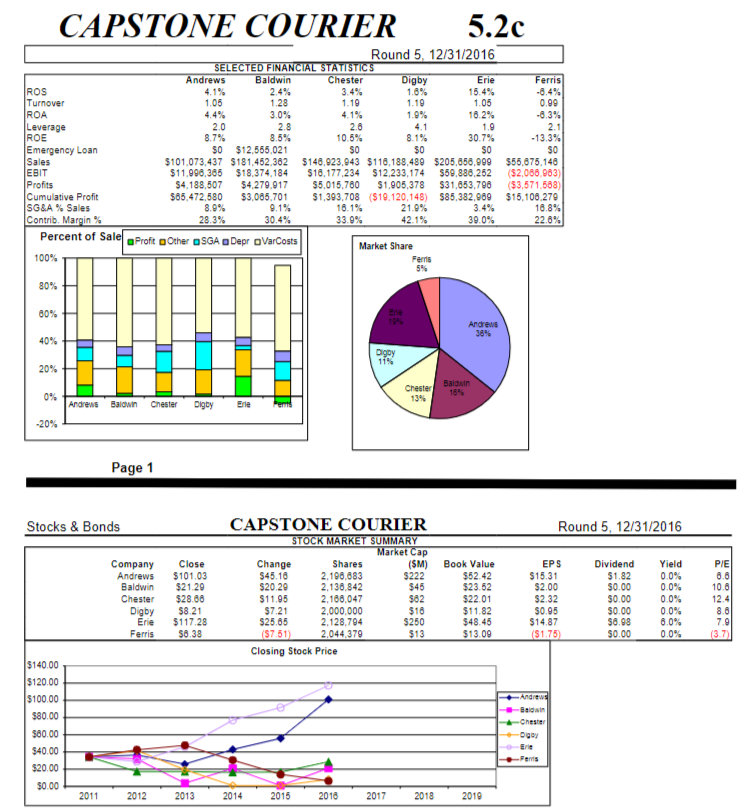
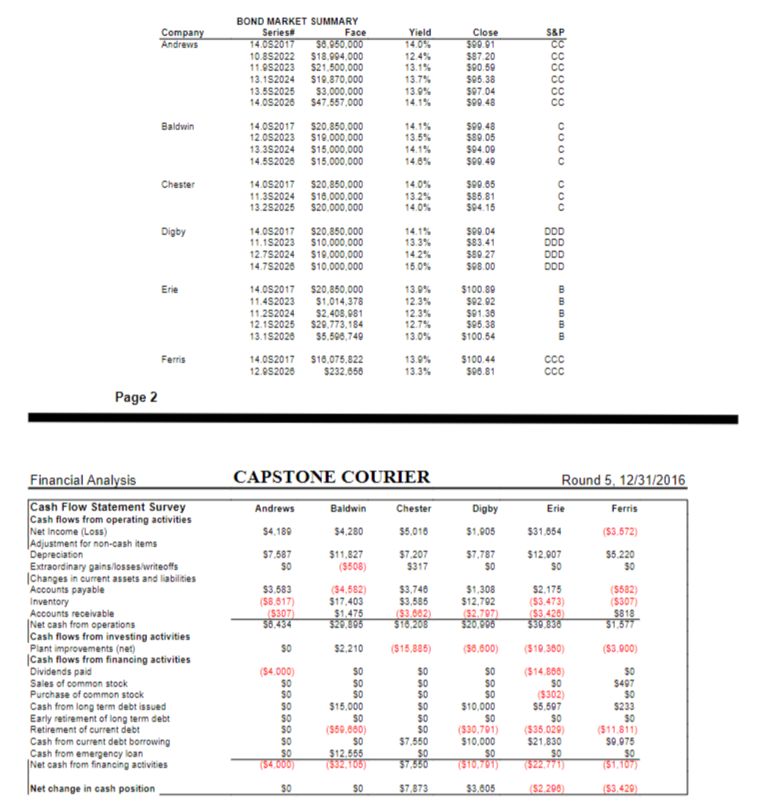
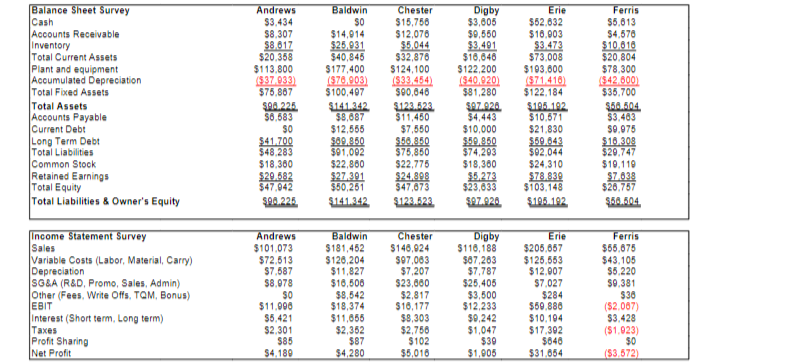
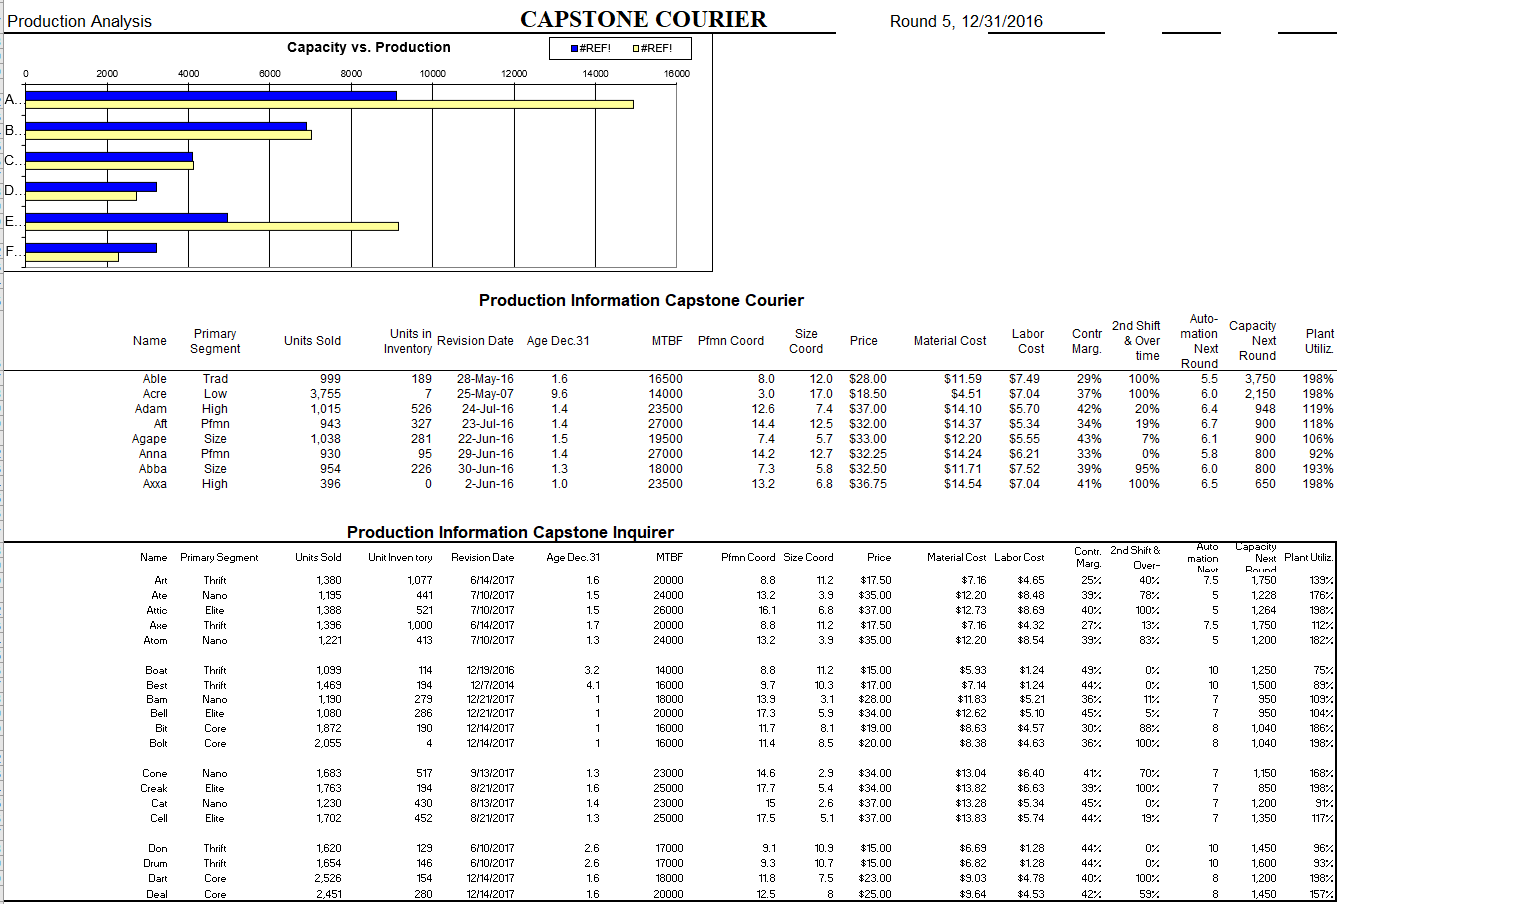
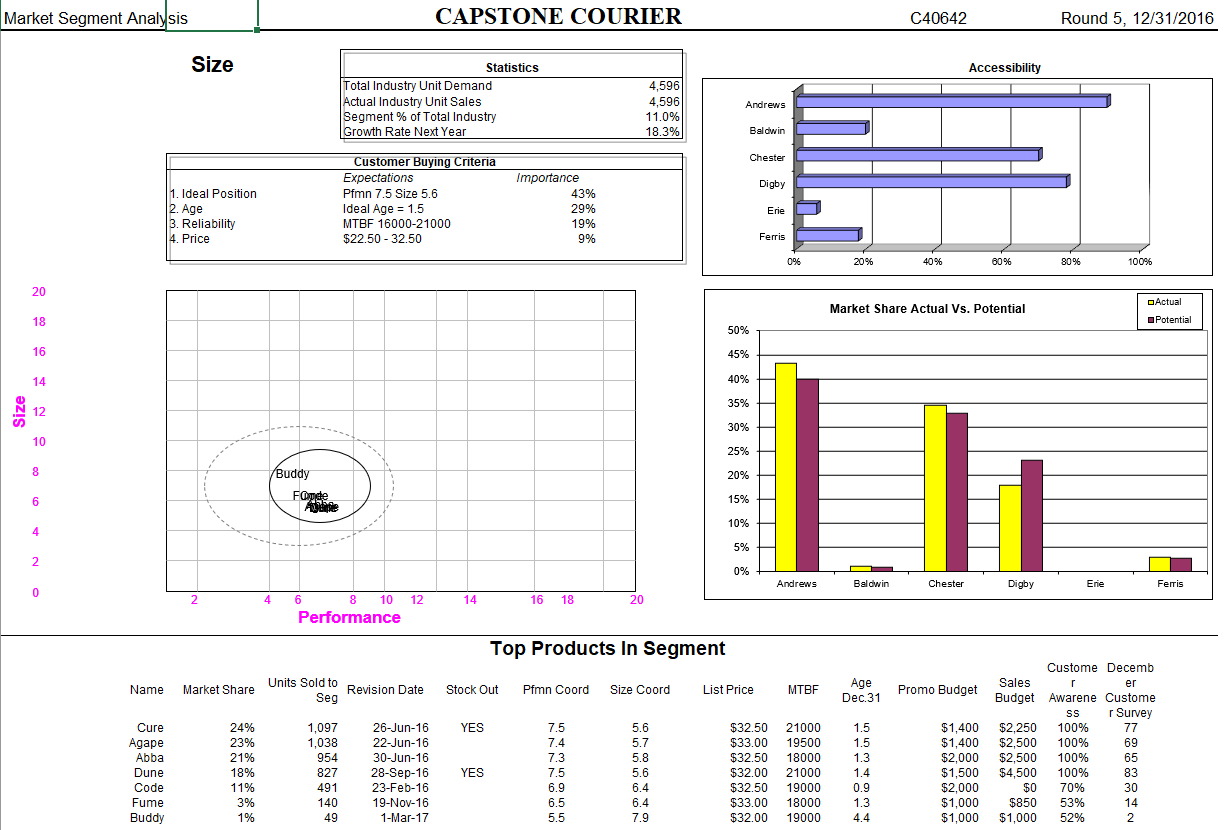
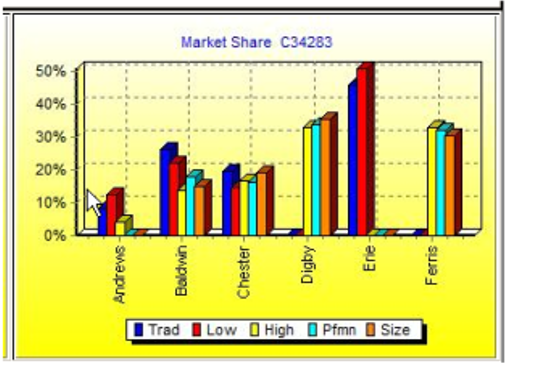
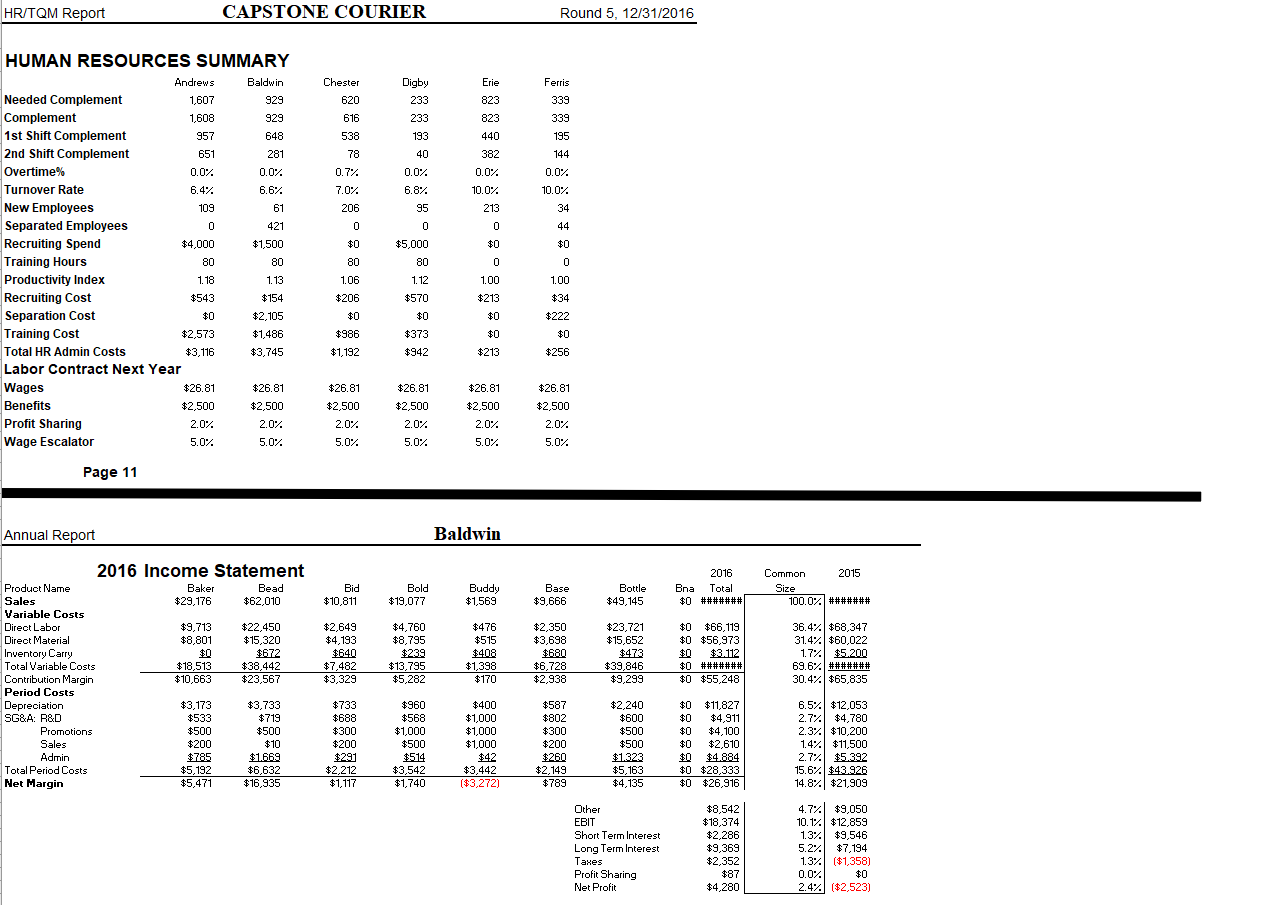
CAPSTONE COURIER 5.2c Round 5. 12/31/2016 SELECTED FINANCIAL STATISTICS Andrews Baldwin Chester Digby Erie Ferris ROS 2.4% 3.4% 1.8% 15.4% Turnover 1.05 1.28 1.10 1.10 1.05 0.99 ROA 3.0% 4.1% 1.9% 16.2% -8.3% Leverage 2.0 2.8 4.1 1.9 2.1 ROE 8.7% 8.5% 10.5% 8.1% 30.7% -13.3% Emergency Loan SO $12.555.021 SO $0 SO SO Sales $101,073,437 $181,452.362 $146.923,943 $116,188,489 $205,656,999 $55,675.148 EBIT $11.098.365 $18,374.184 $16, 177,234 $12.233,174 $59.886,252 (52,068,963) Profits $4.188,507 $4.279.917 $5,015,780 $1,905,378 $31,653,790 ($3,571.588) Cumulative Profit $65.472.580 $3.065.701 $1,393,708 (519,120,148) $85,382,989 $15,106.279 SG&A % Sales 8.9% 9.1% 16.1% 21.9% 3.4% 18.8% Contrib. Margin% 28.3% 30.4% 33.9% 42.1% 30.0% 22.6% Percent of Sale Profit Other DSGA a Depra VarCosts Market Share 100% Ferris 5% 80% 80% Andrews 38% 40% Digby 11% 20% Chester Baldwin 16% 0% Andrews Baldwin Chester Digby Erle -20% Page 1 Stocks & Bonds Round 5, 12/31/2016 PIE Company Andrews Baldwin Chester Digby Erie Ferris Close $101.03 $21.29 $28.68 58.21 $117.28 $6.38 CAPSTONE COURIER STOCK MARKET SUMMARY Market Cap Change Shares (SM) $45.16 2,198,883 $222 $20.29 2.136.842 $45 $11.95 2,168,047 $82 $7.21 2,000,000 $18 $25.05 2,128,794 $250 (57.51 2,044,370 $13 Closing Stock Price Book Value $52.42 $23.52 $22.01 $11.82 $48.45 $13.09 EPS $15.31 $2.00 $2.32 $0.95 $14.87 ($1.75) Dividend $1.82 $0.00 $0.00 $0.00 $6.98 $0.00 Yield 0.0% 0.0% 0.0% 0.0% 8.0% 0.0% 8.6 10.6 12.4 8.6 7.9 (3.7 DOOO $140.00 $120.00 $100,00 $80.00 $80.00 $40.00 $20.00 $0.00 Andrew -Sedan -Chester -Ogey Ere Ferris 2011 2012 2013 2014 2015 2016 2017 2018 2019 Yield Company Andrews BOND MARKET SUMMARY Series Face 14.0S2017 $8,650,000 10.852022 $18.994,000 11.9S2023 $21,500,000 13.15 2024 $19,870,000 13.5S2025 $3,000,000 14.0S2026 $47,557,000 12.4% 13.1% 13.7% 13.9% 14.1% Close 390.01 587.20 $90.50 $95.38 $97.04 $90.48 08808 Baldwin 14.05 2017 12.082023 13.352024 14.552020 $20,850,000 $19,000,000 $15,000,000 $15,000,000 14.1% 13.5% 14.1% 14.6% $90.48 580.05 $94.00 $90.40 0000 Chester 14.0S2017 11.352024 132S2025 $20.850,000 $10,000,000 $20,000,000 14.0% 13.2% 14.0% $90.65 585.81 $94.15 000 Digby 14.0S 2017 11.152023 12.782024 14.752026 $20,850,000 $10,000,000 $19,000,000 $10,000,000 14.1% 13.3% 14.2% 15.0% 300 04 $83.41 $80.27 598.00 DDD DDD DOD DDD Erie 14.05 2017 11.492023 11.25 2024 12.1S2025 13.152026 $20,850,000 $1.014,378 $2.408,981 $29,773,184 $5,590,749 13.9% 12.3% 12.3% 12.7% 13.0% $100.89 $02.02 591.36 $95.38 $100.54 mmmmm Ferris 14.0S2017 12.9S2026 $10,075,822 $232,656 13.9% 13.3% $100.44 $96.81 ccc CCC Page 2 CAPSTONE COURIER Chester Andrews $4.180 57.587 SO Digby $1,905 $5,016 Baldwin 54.280 $11,827 (5508) (54,582) $17.403 $1,475 $20.305 Round 5, 12/31/2016 Erie Ferris $31,654 (53.572) $12.007 $5.220 SO $0 $7.207 $317 $7,787 $0 $3.583 (58.617) 5307 56.434 $3,740 $3,585 183.682) $16.208 $1,308 $12.792 (52 707 $20,000 $2.175 (53.473) 53.420) $39.830 (5582) (5307) $818 $1,577 Financial Analysis Cash Flow Statement Survey Cash flows from operating activities Net Income (Loss) Adjustment for non-cash items Depreciation Extraordinary gains/losses/writeoffs Changes in current assets and liabilities Accounts payable Inventory Accounts receivable Net cash from operations Cash flows from investing activities Plant improvements (net) Cash flows from financing activities Dividends paid Sales of common stock Purchase of common stock Cash from long term debt issued Early retirement of long term debt Retirement of current debt Cash from current debt borrowing Cash from emergency loan Net cash from financing activities Net change in cash position $0 $2,210 ($15,885) (36,800) (54.000) SO SO 50 SO $0 $0 $0 154.000) SO SO SO $15.000 50 (559,680) $0 $12.555 7562.105) $0 $0 50 50 50 $0 $7,550 $0 $7,500 $0 $0 SO $10,000 50 (530,701) $10,000 $0 (510,701) ($10.360) (514.868) $0 (5302) $5,507 50 (535.029) $21.830 $0 (53.900) $0 $497 50 $233 50 (511,811) $0.975 $0 151.1075 $0 $0 $7,873 $3.605 (52 200 (53.429 Balance Sheet Survey Cash Accounts Receivable Inventory Total Current Assets Plant and equipment Accumulated Depreciation Total Fixed Assets Total Assets Accounts Payable Current Debt Long Term Debt Total Liabilities Common Stock Retained Earnings Total Equity Total Liabilities & Owner's Equity Andrews $3,434 $8.307 $8.617 $20.358 $113.800 (587 033) $75.867 SPA.225 $6.683 $0 $41.700 $48,283 $18,360 $20.582 $47.042 $94.225 Baldwin $0 $14,914 $25,031 $40,845 $177,400 (576,903) $100,407 $1241242 $8,887 $12,555 $69.850 $91,002 $22,880 $27.301 $50,251 $141.242 Chester $15,756 $12,078 $5.044 $32,876 $124,100 (533.454) $90,648 $122.22 $11.450 $7,550 $50.850 $75,850 $22,778 $24.898 $47,673 $123.923 Digby $3,805 $9,560 $3.491 $16.646 $122,200 ($40.920) $81,280 $97.02A $4,443 $10,000 $59,850 $74,203 $18,360 $5.273 $23,633 $27.02 Erie $52.632 $16.903 $3.473 $73.008 $103.600 (571410 $122.184 $125.192 $10.571 $21.830 $59.843 $02.044 $24,310 $78.839 $103.148 $15.102 Ferris $5.813 $4,578 $10.610 $20,804 $78,300 $42.600 $35.700 $5.504 $3.463 $9.075 $18.308 $29.747 $10,119 $7639 $20.757 $5.504 Income Statement Survey Sales Variable Costs (Labor, Material, Carry) Depreciation SG&A (R&D, Promo, Sales, Admin) Other (Fees, Write Offs, TOM, Bonus) EBIT interest (Short term, Long term) Taxes Profit Sharing Net Profit Andrews $101.073 $72.513 $7.587 $8.078 SO $11.000 $5,421 $2.301 $85 $4.189 Baldwin $181,452 $126,204 $11,827 $16,506 $8,542 $18,374 $11,655 $2,352 $87 $4,280 Chester $146,924 $97,083 $7.207 $23,660 $2,817 $16,177 $8,303 $2,750 $102 $5,016 Digby $116,188 $67,283 $7,787 $25,405 $3,500 $12,233 $9,242 $1,047 $30 $1,905 Erie $205,057 $125.553 $12.007 $7.027 $284 $59.880 $10.104 $17.392 $840 $31,654 Ferris $55.075 $43.105 $5.220 $9.381 $36 (S2.067) $3,428 ($1.023) $0 153.572) Production Analysis CAPSTONE COURIER Round 5, 12/31/2016 Capacity vs. Production #REFI O#REF! 0 0 2000 4000 6000 8000 10000 12000 14000 16000 A. -B.. c. D.. E. F. Production Information Capstone Courier Name Primary Segment Units Sold Units in Inventory Revision Date Age Dec.31 MTBF Pfmn Coord Size Coord Price Material Cost Labor Cost Conti Marg Capacity Next Round Plant Utiliz Able Acre Adam Aft Agape Anna Abba Axxa Trad Low High Pfmn Size Pfmn Size High 999 3,755 1,015 943 1,038 930 954 396 189 7 526 327 281 95 226 0 28-May-16 25-May-07 24-Jul-16 23-Jul-16 22-Jun-16 29-Jun-16 30-Jun-16 2-Jun-16 1.6 9.6 1.4 1.4 1.5 1.4 1.3 1.0 16500 14000 23500 27000 19500 27000 18000 23500 8.0 3.0 12.6 14.4 7.4 14.2 7.3 13.2 12.0 $28.00 17.0 $18.50 7.4 $37.00 12.5 $32.00 5.7 $33.00 12.7 $32.25 5.8 $32.50 6.8 $36.75 $11.59 $4.51 $14.10 $14.37 $12.20 $14.24 $11.71 $14.54 $7.49 $7.04 $5.70 $5.34 $5.55 $6.21 $7.52 $7.04 29% 37% 42% 34% 43% 33% 39% 41% 2nd Shift & Over time 100% 100% 20% 19% 7% 0% 95% 100% Auto- mation Next Round 5.5 6.0 6.4 6.7 6.1 5.8 6.0 6.5 3,750 2,150 948 900 900 800 800 650 198% 198% 119% 118% 106% 92% 193% 198% Name Primary Segment Units Sold Pfmn Coord Size Coord Price Material Cost Labor Cost Auto mation 7.5 Art Ate Attio Axe Atom 11.2 3.9 Thrift Nano Elite Thrift Nano Production Information Capstone Inquirer Unit Inventory Revision Date Age Dec. 31 MTBF 1,077 6/14/2017 1.6 20000 441 7/10/2017 1.5 24000 521 7/10/2017 1.5 26000 1,000 6/14/2017 1.7 20000 413 7/10/2017 1.3 24000 1,380 1.195 1,388 1,396 1,221 8.8 13.2 16.1 8.8 13.2 $17.50 $35.00 $37.00 $17.50 $35.00 $7.16 $12.20 $12.73 $7.16 $12.20 6.8 11.2 3.9 Contr. 2nd Shift & Marg Over- 25% 40% 39% 78%. 40% 100% 27% 137 39% 83% $4.65 $8.48 $8.69 $4.32 $8.54 Capacity Next Plant Utiliz. Bound 1,750 139% 1.228 176% 1,264 1987 1,750 11274 1,200 1822 3.2 Boat Best Bam Bell Bit Bolt Thrift Thrift Nano Elite Core Core 1,099 1,469 1,190 1,080 1,872 2,055 114 194 279 286 190 4 12/19/2016 12/7/2014 12/21/2017 12/21/2017 12/14/2017 12/14/2017 4.1 1 1 1 1 1 14000 16000 18000 20000 16000 16000 8.8 9.7 13.9 17.3 11.7 11.4 11.2 10.3 3.1 5.9 8. 8.5 $15.00 $17.00 $28.00 $34.00 $19.00 $20.00 $5.93 $7.14 $11.83 $12.62 $8.63 $8.38 $1.24 $1.24 $5.21 $5.10 $4.57 $4.63 49% 44% 36% 45% 30% 36% 0% 0% 11% 5%. 88% 100% wwww nawrt aanald 1,250 1,500 950 950 1,040 1,040 754) 89% 1097 1042 1867 1987 2.9 5.4 Cone Creak Cat Cell Nano Elite Nano Elite 1,683 1,763 1,230 1,702 517 194 430 452 9/13/2017 8/21/2017 8/13/2017 8/21/2017 1.3 1.6 1.4 1.3 23000 25000 23000 25000 14.6 17.7 15 17.5 $34.00 $34.00 $37.00 $37.00 $13.04 $13.82 $13.28 $13.83 $6.40 $6.63 $5.34 $5.74 41% 397. 45%. 44% 70% 100% 0% 197 1,150 850 1,200 1,350 1687 1987 91% 117% 2.6 5.1 Don Drum Dart Deal Thrift Thrift Core Core 1,620 1,654 2,526 2,451 129 146 154 280 6/10/2017 6/10/2017 12/14/2017 12/14/2017 2.6 2.6 1.6 1.6 17000 17000 18000 20000 9.1 9.3 11.8 12.5 10.9 10.7 7.5 $15.00 $15.00 $23.00 $25.00 $6.69 $6.82 $9.03 $9.64 $1.28 $1.28 $4.78 $4.53 44% 44% 4074 427 07 0% 100% 597 10 10 8 8 1,450 1,600 1,200 1,450 96% 93% 1982 1572 8 CAPSTONE COURIER Round 5, 12/31/2016 Market Segment Analysis Traditional Accessibility Statistics Total Industry Unit Demand Actual Industry Unit Sales Segment % of Total Industry Growth Rate Next Year 11,471 11,291 27.5% 9.2% Andrews Baldwin Chester Customer Buying Criteria Digby Expectations Ideal Age = 2.0 $17.50 - 27.50 Pfmn 8.5 Size 11.5 MTBF 14000-19000 1. Age 12. Price 3. Ideal Position 4. Reliability Importance 47% 23% 21% 9% Erie Ferris 0% 20% 40% 60% 80% 100% 20 Market Share Actual Vs. Potential #REF! #REFI 18 60% 16 Fast 50% 14 Size 12 Baker nie 40% 10 30% 8 20% 6 4 10% 2 0% Andrews Baldwin Chester Digby Erie Ferris 0 2 4 14 16 18 20 6 8 8 10 12 Performance Top Products In Segment Name Market Share Units Sold to Seg Revision Date Stock Out Pfmn Coord Size Coord List Price MTBF Age Dec.31 Promo Budget Custome Decemb Sales r er Budget Awarene Custome SS r Survey $2,500 100% 31 $1,200 84% 52 $300 19% 0 $200 67% 15 YES YES Able Eat Fast Baker 52% 41% 5% 2% 5,832 4,640 541 278 28-May-16 23-Sep-16 29-Jan-14 10-Jul-16 8.0 8.0 5.4 7.3 12.0 12.2 14.6 12.0 $25.00 $26.00 $22.00 $23.50 16500 16000 17000 17000 1.6 1.6 6.4 3.1 $1,400 $1,100 $300 $500 YES Market Segment Analysis CAPSTONE COURIER C40642 Round 5, 12/31/2016 Low End Accessibility Statistics Total Industry Unit Demand Actual Industry Unit Sales Segment % of Total Industry Growth Rate Next Year 15,581 15,581 37.3% 11.7% Andrews Baldwin Chester Digby Customer Buying Criteria Expectations $12.50 -22.50 Ideal Age = 7.0 Pfmn 4.2 Size 15.8 MTBF 12000-17000 1. Price 2. Age 3. Ideal Position 4. Reliability Importance 53% 24% 16% 7% Erie Ferris 0% 20% 40% 60% 8096 100% 20 Actual Market Share Actual Vs. Potential 18 Potential 50% Acre 16 elle 45% Fast 14 40% 35% Size 12 Baker Abal 30% 10 25% 8 20% 6 15% 10% 4 5% 2 0% Andrews Baldwin Chester Digby Erie Ferris 0 2 4 8 14 16 18 20 6 10 12 Performance Top Products In Segment Name Market Share Units Sold to Seg Revision Date Stock Out Pfmn Coord Size Coord List Price MTBF Age Dec. 31 Promo Budget Ebb Acre Bead Bottle Fast Baker Eat Able 27% 24% 19% 16% 7% 6% 0% 0% 4,233 3,755 3,025 2,520 1,061 963 14 10 22-Jan-16 25-May-07 16-Sep-16 4-Aug-16 29-Jan-14 10-Jul-16 23-Sep-16 28-May-16 4.0 3.0 4.5 4.8 5.4 7.3 8.0 8.0 16.0 17.0 16.3 15.8 14.6 12.0 12.2 12.0 $20.00 $18.50 $20.50 $19.50 $22.00 $23.50 $26.00 $25.00 17000 14000 14000 17000 17000 17000 16000 16500 5.3 9.6 4.9 1.6 6.4 3.1 1.6 1.6 $1,100 $1,400 $500 $500 $300 $500 $1.100 $1,400 Custome Decemb Sales r er Budget Awarene Custome SS r Survey $1,175 84% 18 $2,500 100% 19 $10 72% 10 $500 47% 12 $300 19% 6 $200 67% 0 $1,200 84% 0 $2,500 100% 0 YES YES YES Market Segment Analysis CAPSTONE COURIER C40642 Round 5, 12/31/2016 High End Accessibility Statistics Total Industry Unit Demand Actual Industry Unit Sales Segment % of Total Industry Growth Rate Next Year 5,410 5,410 13.0% 16.2% Andrews Baldwin Chester Digby 1. Ideal Position 2. Age 3. Reliability 4. Price Customer Buying Criteria Expectations Pfmn 13.4 Size 6.6 Ideal Age = 0.0 MTBF 20000-25000 $27.50 - 37.50 Importance 43% 29% 19% 9% Erie Ferris 0% 20% 40% 60% 80% 100% 20 Actual Market Share Actual Vs. Potential 18 Potential 50% 16 45% 14 40% 35% Size 12 30% 10 25% 8 20% Baganfista 6 15% 10% 4 5% 2 0% Andrews Baldwin Chester Digby Erie Ferris 0 2 4 6 10 12 14 16 18 20 8 Performance Top Products In Segment Name Market Share Units Sold to Seg Revision Date Stock Out Pfmn Coord Size Coord List Price MTBF Age Dec. 31 Promo Budget YES Dixie Adam Cash Cid Axxa Dale Fist Bid Base 24% 19% 16% 11% 7% 7% 6% 5% 5% 1,302 1,015 888 580 396 371 308 292 258 6-Oct-16 24-Jul-16 23-Aug-16 4-Jul-16 2-Jun-16 14-May-16 19-Nov-16 - 4-Sep-16 15-Oct-16 YES YES YES YES 13.4 12.6 13.4 13.4 13.2 13.4 12.5 13.0 12.1 6.6 7.4 6.6 6.6 6.8 6.6 7.5 7.3 7.0 $37.00 $37.00 $37.50 $37.50 $36.75 $37.00 $37.50 $37.00 $37.50 25000 23500 25000 23000 23500 25000 24000 25000 25000 1.3 1.4 1.2 1.8 1.0 0.6 1.2 2.6 1.8 $1,500 $1,400 $1.750 $1,400 $2,000 $1,500 Custome Decemb Sales r er Budget Awarene Custome SS r Survey $2,500 100% 67 $2.500 100% 47 $1,200 98% 61 $1,200 100% 43 $2,500 95% 63 $2,500 61% 64 $850 53% 22 $200 68% 29 $200 69% 29 $1,000 $300 $300 Market Segment Analysis CAPSTONE COURIER C40642 Round 5, 12/31/2016 Performance Accessibility Statistics Total Industry Unit Demand Actual Industry Unit Sales Segment % of Total Industry Growth Rate Next Year Andrews 4,726 4,726 11.3% 19.8% Baldwin Chester Digby Customer Buying Criteria Expectations MTBF 22000-27000 Pfmn 14.4 Size 12.5 $22.50 -32.50 Ideal Age = 1.0 1. Reliability 2. Ideal Position 3. Price 4. Age Importance 43% 29% 19% 9% Erie Ferris 0% 20% 40% 60% 8096 100% 20 Market Share Actual Vs. Potential Actual Potential 18 50% 16 45% 14 40% FGAN 35% Size 12 30% % 10 25% 8 20% 6 15% 10% 4 5% 2 0% Andrews Baldwin Chester Digby Erie Ferris 0 2 4 12 14 16 18 20 6 8 10 Performance Top Products In Segment Units Sold to Revision Date Name Market Share Stock Out Pfmn Coord Size Coord List Price MTBF Age Dec. 31 Promo Budget Seg Aft Anna 20% 20% 18% 17% 13% 9% 3% Dot Coat Bold Cool Foam 943 930 870 811 606 437 129 23-Jul-16 29-Jun-16 28-Sep-16 9-Jul-16 23-Jul-16 10-Apr-16 11-Oct-16 14.4 14.2 14.4 14.4 14.3 13.6 13.4 12.5 12.7 12.5 12.5 12.4 13.0 12.8 $32.00 $32.25 $32.00 $32.25 $31.50 $32.25 $33.00 27000 27000 27000 27000 27000 27000 24000 1.4 1.4 1.3 1.5 1.6 0.7 1.3 Custome Decemb Sales r er Budget Awarene Custome SS r Survey $2,500 100% 72 $2,500 100% 71 $4,500 100% 69 $2,250 100% 62 $500 87% 47 $0 70% 44 $850 53% 12 $1,400 $1,400 $1,500 $1,400 $1,000 $2,000 $1,000 Market Segment Analysis CAPSTONE COURIER C40642 Round 5, 12/31/2016 Size Accessibility Statistics Total Industry Unit Demand Actual Industry Unit Sales Segment % of Total Industry Growth Rate Next Year 4,596 4,596 11.0% 18.3% Andrews Baldwin Chester Digby Customer Buying Criteria Expectations Pfmn 7.5 Size 5.6 Ideal Age = 1.5 MTBF 16000-21000 $22.50 -32.50 = 1. Ideal Position 2. Age 3. Reliability 4. Price Importance 43% 29% 19% 9% Erie Ferris 0% 20% 40% 60% 80% 100% 20 Market Share Actual Vs. Potential Actual Potential 18 50% 16 45% 14 40% 35% Size 12 30% 10 25% 8 20% % Buddy FOopee Athe 6 15% 10% 4 5% 2 0% Andrews Baldwin Chester Digby Erie Ferris 0 2 4 8 12 14 16 18 20 6 10 Performance Top Products In Segment Units Sold to Revision Date Name Market Share Stock Out Pfmn Coord Size Coord List Price MTBF Age Dec.31 Promo Budget Seg YES Cure Agape Abba Dune Code Fume Buddy 24% 23% 21% 18% 11% 3% 1% 1,097 1,038 954 827 491 140 49 26-Jun-16 22-Jun-16 30-Jun-16 28-Sep-16 23-Feb-16 19-Nov-16 1-Mar-17 7.5 7.4 7.3 7.5 6.9 6.5 5.5 YES 5.6 5.7 5.8 5.6 6.4 6.4 7.9 $32.50 $33.00 $32.50 $32.00 $32.50 $33.00 $32.00 21000 19500 18000 21000 19000 18000 19000 1.5 1.5 1.3 1.4 0.9 1.3 4.4 Custome Decemb Sales r er Budget Awarene Custome SS r Survey $2,250 100% 77 $2,500 100% 69 $2,500 100% 65 100% 83 $0 70% 30 $850 53% 14 $1,000 52% 2 $1,400 $1,400 $2,000 $1,500 $2,000 $1,000 $1,000 $ $4,500 Market Share C34283 50% 40% 30% 20% ht 10% 0% Andrews Erie Baldwin Chester Digby Ferris Trad I Low High Pfmn Size HR/TQM Report CAPSTONE COURIER Round 5, 12/31/2016 Erie Chester 620 Digby 233 Ferris 339 823 616 233 823 339 538 440 195 193 40 144 78 0.7% 382 0.07. 0.07 6.87 95 0.0% 100% 7.0% 10.0% 213 206 34 0 44 0 $0 $0 HUMAN RESOURCES SUMMARY Andrews Baldwin Needed Complement 1,607 929 Complement 1,608 929 1st Shift Complement 957 648 2nd Shift Complement 651 281 Overtime% 0.0% 0.0% Turnover Rate 6.4% 6.6% New Employees 109 61 Separated Employees 0 421 Recruiting Spend $4,000 $1,500 Training Hours 80 80 Productivity Index 1.18 1.13 Recruiting Cost $543 $154 Separation Cost $0 $2,105 Training Cost $2,573 $1,486 Total HR Admin Costs $3,116 $3,745 Labor Contract Next Year Wages $26.81 $26.81 Benefits $2.500 $2,500 Profit Sharing 2.07 2.0% Wage Escalator 5.0% 5.07 0 $5,000 80 1.12 $0 0 80 1.06 100 1.00 $570 $213 $34 $0 $0 $206 $0 $986 $1,192 $373 $222 $0 $256 $942 $213 $26.81 $2,500 $26.81 $2,500 $26.81 $2,500 $26.81 $2,500 2.0% % 5.07 2.0% 5.02 2.0% 5.07. 2.07 5.02 Page 11 Annual Report Baldwin Bid $10,811 Bold $19,077 Buddy $1,569 Base $9,666 Bottle $49,145 2016 Bna Total $0 ####### Common 2015 Size 100.02 ####### 2016 Income Statement Product Name Baker Bead Sales $29,176 $62,010 Variable Costs Direct Labor $9,713 $22,450 Direct Material $8,801 $15.320 Inventory Carry $0 $672 Total Variable Costs $18,513 $38,442 Contribution Margin $10,663 $23,567 Period Costs Depreciation $3.173 $3,733 SG&A: R&D $533 $719 Promotions $500 $500 Sales $200 $10 Admin $785 $1.669 Total Period Costs $5,192 $6.632 Net Margin $5,471 $16,935 $2,649 $4,193 $640 $7,482 $3,329 $ $4,760 $8,795 $239 $13,795 $5,282 $476 $515 $408 $1,398 $170 $2,350 $3,698 $680 $6,728 $2,938 $23,721 $15,652 $473 $39,846 $9,299 $0 $66,119 $0 $56,973 $3.112 $0 ####### $0 $55.248 36.42 $68,347 31.42 $60,022 1.77 $5.200 69.67####### 30.42 $65,835 $733 $688 $300 $200 $291 $2,212 $1.117 $960 $568 $1,000 $500 $514 $3,542 $1,740 $400 $1,000 $1,000 $1,000 $42 $3,442 ($3,272) $587 $802 $300 $200 $260 $2,149 $789 $2,240 $600 $500 $500 $1.323 $5,163 $4.135 $0 $11,827 $0 $4,911 $0 $4,100 $0 $2,610 $4.884 $0 $28,333 $0 $26,916 6.54 $12,053 2.74 $4,780 2.32 $10,200 1.47 $11,500 2.77 $5.392 15.67 $43.926 14.87 $21,909 Other EBIT Short Term Interest Long Term Interest Taxes Profit Sharing Net Profit $8,542 $18,374 $2,286 $9,369 $2,352 $87 $4,280 4.724 $9,050 10.12 $12,859 1.32 $9,546 5.22 $7,194 $ 13% ($1,358) 0.0%. $0 2.4% ($2,523) Andrew's product manager is considering lowering the price of Acre by $2.50 and wants to know what the impact will be on the product's contribution margin. Assuming no inventory carrying costs, what will Acre's contribution margin be if the price is lowered? O 37.56% O 23.25% O 27.81% 11.55% O 43.44% Demand is created through meeting customer buying criteria, credit terms, awareness (promotion) and accessibility (distribution). According to the December Customer Survey, which of these products was the most competitive at the end of the year in the low end market? Bead O Bottle O Fast O Ebb O Acre Andrews currently has $3,434 (000) in cash. Assuming this year's cash from operations will remain unchanged, and the most capital the company can raise is $15,000 (000), what activity exposes the company to the most risk of being issued and emergency loan? O Retiring the oldest bond O Issuing a $2.00 dividend O Purchasing $30,000 (000) worth of plant and equipment O Getting rid of all the inventory Which description best fits Erie in your industry? Refer to the Market Share Report in the Courier. --A differentiator competes through good designs, high awareness, and easy accessibility -- A cost leader competes on price by reducing costs and passing the savings to customers --A broad player competes an all parts of the market. --A niche player competes in selected parts of the market. Erie is a niche cost leader O Erie is a niche differentiator O Erie is a broad cost leader O Erie is a broad differentiator CAPSTONE COURIER 5.2c Round 5. 12/31/2016 SELECTED FINANCIAL STATISTICS Andrews Baldwin Chester Digby Erie Ferris ROS 2.4% 3.4% 1.8% 15.4% Turnover 1.05 1.28 1.10 1.10 1.05 0.99 ROA 3.0% 4.1% 1.9% 16.2% -8.3% Leverage 2.0 2.8 4.1 1.9 2.1 ROE 8.7% 8.5% 10.5% 8.1% 30.7% -13.3% Emergency Loan SO $12.555.021 SO $0 SO SO Sales $101,073,437 $181,452.362 $146.923,943 $116,188,489 $205,656,999 $55,675.148 EBIT $11.098.365 $18,374.184 $16, 177,234 $12.233,174 $59.886,252 (52,068,963) Profits $4.188,507 $4.279.917 $5,015,780 $1,905,378 $31,653,790 ($3,571.588) Cumulative Profit $65.472.580 $3.065.701 $1,393,708 (519,120,148) $85,382,989 $15,106.279 SG&A % Sales 8.9% 9.1% 16.1% 21.9% 3.4% 18.8% Contrib. Margin% 28.3% 30.4% 33.9% 42.1% 30.0% 22.6% Percent of Sale Profit Other DSGA a Depra VarCosts Market Share 100% Ferris 5% 80% 80% Andrews 38% 40% Digby 11% 20% Chester Baldwin 16% 0% Andrews Baldwin Chester Digby Erle -20% Page 1 Stocks & Bonds Round 5, 12/31/2016 PIE Company Andrews Baldwin Chester Digby Erie Ferris Close $101.03 $21.29 $28.68 58.21 $117.28 $6.38 CAPSTONE COURIER STOCK MARKET SUMMARY Market Cap Change Shares (SM) $45.16 2,198,883 $222 $20.29 2.136.842 $45 $11.95 2,168,047 $82 $7.21 2,000,000 $18 $25.05 2,128,794 $250 (57.51 2,044,370 $13 Closing Stock Price Book Value $52.42 $23.52 $22.01 $11.82 $48.45 $13.09 EPS $15.31 $2.00 $2.32 $0.95 $14.87 ($1.75) Dividend $1.82 $0.00 $0.00 $0.00 $6.98 $0.00 Yield 0.0% 0.0% 0.0% 0.0% 8.0% 0.0% 8.6 10.6 12.4 8.6 7.9 (3.7 DOOO $140.00 $120.00 $100,00 $80.00 $80.00 $40.00 $20.00 $0.00 Andrew -Sedan -Chester -Ogey Ere Ferris 2011 2012 2013 2014 2015 2016 2017 2018 2019 Yield Company Andrews BOND MARKET SUMMARY Series Face 14.0S2017 $8,650,000 10.852022 $18.994,000 11.9S2023 $21,500,000 13.15 2024 $19,870,000 13.5S2025 $3,000,000 14.0S2026 $47,557,000 12.4% 13.1% 13.7% 13.9% 14.1% Close 390.01 587.20 $90.50 $95.38 $97.04 $90.48 08808 Baldwin 14.05 2017 12.082023 13.352024 14.552020 $20,850,000 $19,000,000 $15,000,000 $15,000,000 14.1% 13.5% 14.1% 14.6% $90.48 580.05 $94.00 $90.40 0000 Chester 14.0S2017 11.352024 132S2025 $20.850,000 $10,000,000 $20,000,000 14.0% 13.2% 14.0% $90.65 585.81 $94.15 000 Digby 14.0S 2017 11.152023 12.782024 14.752026 $20,850,000 $10,000,000 $19,000,000 $10,000,000 14.1% 13.3% 14.2% 15.0% 300 04 $83.41 $80.27 598.00 DDD DDD DOD DDD Erie 14.05 2017 11.492023 11.25 2024 12.1S2025 13.152026 $20,850,000 $1.014,378 $2.408,981 $29,773,184 $5,590,749 13.9% 12.3% 12.3% 12.7% 13.0% $100.89 $02.02 591.36 $95.38 $100.54 mmmmm Ferris 14.0S2017 12.9S2026 $10,075,822 $232,656 13.9% 13.3% $100.44 $96.81 ccc CCC Page 2 CAPSTONE COURIER Chester Andrews $4.180 57.587 SO Digby $1,905 $5,016 Baldwin 54.280 $11,827 (5508) (54,582) $17.403 $1,475 $20.305 Round 5, 12/31/2016 Erie Ferris $31,654 (53.572) $12.007 $5.220 SO $0 $7.207 $317 $7,787 $0 $3.583 (58.617) 5307 56.434 $3,740 $3,585 183.682) $16.208 $1,308 $12.792 (52 707 $20,000 $2.175 (53.473) 53.420) $39.830 (5582) (5307) $818 $1,577 Financial Analysis Cash Flow Statement Survey Cash flows from operating activities Net Income (Loss) Adjustment for non-cash items Depreciation Extraordinary gains/losses/writeoffs Changes in current assets and liabilities Accounts payable Inventory Accounts receivable Net cash from operations Cash flows from investing activities Plant improvements (net) Cash flows from financing activities Dividends paid Sales of common stock Purchase of common stock Cash from long term debt issued Early retirement of long term debt Retirement of current debt Cash from current debt borrowing Cash from emergency loan Net cash from financing activities Net change in cash position $0 $2,210 ($15,885) (36,800) (54.000) SO SO 50 SO $0 $0 $0 154.000) SO SO SO $15.000 50 (559,680) $0 $12.555 7562.105) $0 $0 50 50 50 $0 $7,550 $0 $7,500 $0 $0 SO $10,000 50 (530,701) $10,000 $0 (510,701) ($10.360) (514.868) $0 (5302) $5,507 50 (535.029) $21.830 $0 (53.900) $0 $497 50 $233 50 (511,811) $0.975 $0 151.1075 $0 $0 $7,873 $3.605 (52 200 (53.429 Balance Sheet Survey Cash Accounts Receivable Inventory Total Current Assets Plant and equipment Accumulated Depreciation Total Fixed Assets Total Assets Accounts Payable Current Debt Long Term Debt Total Liabilities Common Stock Retained Earnings Total Equity Total Liabilities & Owner's Equity Andrews $3,434 $8.307 $8.617 $20.358 $113.800 (587 033) $75.867 SPA.225 $6.683 $0 $41.700 $48,283 $18,360 $20.582 $47.042 $94.225 Baldwin $0 $14,914 $25,031 $40,845 $177,400 (576,903) $100,407 $1241242 $8,887 $12,555 $69.850 $91,002 $22,880 $27.301 $50,251 $141.242 Chester $15,756 $12,078 $5.044 $32,876 $124,100 (533.454) $90,648 $122.22 $11.450 $7,550 $50.850 $75,850 $22,778 $24.898 $47,673 $123.923 Digby $3,805 $9,560 $3.491 $16.646 $122,200 ($40.920) $81,280 $97.02A $4,443 $10,000 $59,850 $74,203 $18,360 $5.273 $23,633 $27.02 Erie $52.632 $16.903 $3.473 $73.008 $103.600 (571410 $122.184 $125.192 $10.571 $21.830 $59.843 $02.044 $24,310 $78.839 $103.148 $15.102 Ferris $5.813 $4,578 $10.610 $20,804 $78,300 $42.600 $35.700 $5.504 $3.463 $9.075 $18.308 $29.747 $10,119 $7639 $20.757 $5.504 Income Statement Survey Sales Variable Costs (Labor, Material, Carry) Depreciation SG&A (R&D, Promo, Sales, Admin) Other (Fees, Write Offs, TOM, Bonus) EBIT interest (Short term, Long term) Taxes Profit Sharing Net Profit Andrews $101.073 $72.513 $7.587 $8.078 SO $11.000 $5,421 $2.301 $85 $4.189 Baldwin $181,452 $126,204 $11,827 $16,506 $8,542 $18,374 $11,655 $2,352 $87 $4,280 Chester $146,924 $97,083 $7.207 $23,660 $2,817 $16,177 $8,303 $2,750 $102 $5,016 Digby $116,188 $67,283 $7,787 $25,405 $3,500 $12,233 $9,242 $1,047 $30 $1,905 Erie $205,057 $125.553 $12.007 $7.027 $284 $59.880 $10.104 $17.392 $840 $31,654 Ferris $55.075 $43.105 $5.220 $9.381 $36 (S2.067) $3,428 ($1.023) $0 153.572) Production Analysis CAPSTONE COURIER Round 5, 12/31/2016 Capacity vs. Production #REFI O#REF! 0 0 2000 4000 6000 8000 10000 12000 14000 16000 A. -B.. c. D.. E. F. Production Information Capstone Courier Name Primary Segment Units Sold Units in Inventory Revision Date Age Dec.31 MTBF Pfmn Coord Size Coord Price Material Cost Labor Cost Conti Marg Capacity Next Round Plant Utiliz Able Acre Adam Aft Agape Anna Abba Axxa Trad Low High Pfmn Size Pfmn Size High 999 3,755 1,015 943 1,038 930 954 396 189 7 526 327 281 95 226 0 28-May-16 25-May-07 24-Jul-16 23-Jul-16 22-Jun-16 29-Jun-16 30-Jun-16 2-Jun-16 1.6 9.6 1.4 1.4 1.5 1.4 1.3 1.0 16500 14000 23500 27000 19500 27000 18000 23500 8.0 3.0 12.6 14.4 7.4 14.2 7.3 13.2 12.0 $28.00 17.0 $18.50 7.4 $37.00 12.5 $32.00 5.7 $33.00 12.7 $32.25 5.8 $32.50 6.8 $36.75 $11.59 $4.51 $14.10 $14.37 $12.20 $14.24 $11.71 $14.54 $7.49 $7.04 $5.70 $5.34 $5.55 $6.21 $7.52 $7.04 29% 37% 42% 34% 43% 33% 39% 41% 2nd Shift & Over time 100% 100% 20% 19% 7% 0% 95% 100% Auto- mation Next Round 5.5 6.0 6.4 6.7 6.1 5.8 6.0 6.5 3,750 2,150 948 900 900 800 800 650 198% 198% 119% 118% 106% 92% 193% 198% Name Primary Segment Units Sold Pfmn Coord Size Coord Price Material Cost Labor Cost Auto mation 7.5 Art Ate Attio Axe Atom 11.2 3.9 Thrift Nano Elite Thrift Nano Production Information Capstone Inquirer Unit Inventory Revision Date Age Dec. 31 MTBF 1,077 6/14/2017 1.6 20000 441 7/10/2017 1.5 24000 521 7/10/2017 1.5 26000 1,000 6/14/2017 1.7 20000 413 7/10/2017 1.3 24000 1,380 1.195 1,388 1,396 1,221 8.8 13.2 16.1 8.8 13.2 $17.50 $35.00 $37.00 $17.50 $35.00 $7.16 $12.20 $12.73 $7.16 $12.20 6.8 11.2 3.9 Contr. 2nd Shift & Marg Over- 25% 40% 39% 78%. 40% 100% 27% 137 39% 83% $4.65 $8.48 $8.69 $4.32 $8.54 Capacity Next Plant Utiliz. Bound 1,750 139% 1.228 176% 1,264 1987 1,750 11274 1,200 1822 3.2 Boat Best Bam Bell Bit Bolt Thrift Thrift Nano Elite Core Core 1,099 1,469 1,190 1,080 1,872 2,055 114 194 279 286 190 4 12/19/2016 12/7/2014 12/21/2017 12/21/2017 12/14/2017 12/14/2017 4.1 1 1 1 1 1 14000 16000 18000 20000 16000 16000 8.8 9.7 13.9 17.3 11.7 11.4 11.2 10.3 3.1 5.9 8. 8.5 $15.00 $17.00 $28.00 $34.00 $19.00 $20.00 $5.93 $7.14 $11.83 $12.62 $8.63 $8.38 $1.24 $1.24 $5.21 $5.10 $4.57 $4.63 49% 44% 36% 45% 30% 36% 0% 0% 11% 5%. 88% 100% wwww nawrt aanald 1,250 1,500 950 950 1,040 1,040 754) 89% 1097 1042 1867 1987 2.9 5.4 Cone Creak Cat Cell Nano Elite Nano Elite 1,683 1,763 1,230 1,702 517 194 430 452 9/13/2017 8/21/2017 8/13/2017 8/21/2017 1.3 1.6 1.4 1.3 23000 25000 23000 25000 14.6 17.7 15 17.5 $34.00 $34.00 $37.00 $37.00 $13.04 $13.82 $13.28 $13.83 $6.40 $6.63 $5.34 $5.74 41% 397. 45%. 44% 70% 100% 0% 197 1,150 850 1,200 1,350 1687 1987 91% 117% 2.6 5.1 Don Drum Dart Deal Thrift Thrift Core Core 1,620 1,654 2,526 2,451 129 146 154 280 6/10/2017 6/10/2017 12/14/2017 12/14/2017 2.6 2.6 1.6 1.6 17000 17000 18000 20000 9.1 9.3 11.8 12.5 10.9 10.7 7.5 $15.00 $15.00 $23.00 $25.00 $6.69 $6.82 $9.03 $9.64 $1.28 $1.28 $4.78 $4.53 44% 44% 4074 427 07 0% 100% 597 10 10 8 8 1,450 1,600 1,200 1,450 96% 93% 1982 1572 8 CAPSTONE COURIER Round 5, 12/31/2016 Market Segment Analysis Traditional Accessibility Statistics Total Industry Unit Demand Actual Industry Unit Sales Segment % of Total Industry Growth Rate Next Year 11,471 11,291 27.5% 9.2% Andrews Baldwin Chester Customer Buying Criteria Digby Expectations Ideal Age = 2.0 $17.50 - 27.50 Pfmn 8.5 Size 11.5 MTBF 14000-19000 1. Age 12. Price 3. Ideal Position 4. Reliability Importance 47% 23% 21% 9% Erie Ferris 0% 20% 40% 60% 80% 100% 20 Market Share Actual Vs. Potential #REF! #REFI 18 60% 16 Fast 50% 14 Size 12 Baker nie 40% 10 30% 8 20% 6 4 10% 2 0% Andrews Baldwin Chester Digby Erie Ferris 0 2 4 14 16 18 20 6 8 8 10 12 Performance Top Products In Segment Name Market Share Units Sold to Seg Revision Date Stock Out Pfmn Coord Size Coord List Price MTBF Age Dec.31 Promo Budget Custome Decemb Sales r er Budget Awarene Custome SS r Survey $2,500 100% 31 $1,200 84% 52 $300 19% 0 $200 67% 15 YES YES Able Eat Fast Baker 52% 41% 5% 2% 5,832 4,640 541 278 28-May-16 23-Sep-16 29-Jan-14 10-Jul-16 8.0 8.0 5.4 7.3 12.0 12.2 14.6 12.0 $25.00 $26.00 $22.00 $23.50 16500 16000 17000 17000 1.6 1.6 6.4 3.1 $1,400 $1,100 $300 $500 YES Market Segment Analysis CAPSTONE COURIER C40642 Round 5, 12/31/2016 Low End Accessibility Statistics Total Industry Unit Demand Actual Industry Unit Sales Segment % of Total Industry Growth Rate Next Year 15,581 15,581 37.3% 11.7% Andrews Baldwin Chester Digby Customer Buying Criteria Expectations $12.50 -22.50 Ideal Age = 7.0 Pfmn 4.2 Size 15.8 MTBF 12000-17000 1. Price 2. Age 3. Ideal Position 4. Reliability Importance 53% 24% 16% 7% Erie Ferris 0% 20% 40% 60% 8096 100% 20 Actual Market Share Actual Vs. Potential 18 Potential 50% Acre 16 elle 45% Fast 14 40% 35% Size 12 Baker Abal 30% 10 25% 8 20% 6 15% 10% 4 5% 2 0% Andrews Baldwin Chester Digby Erie Ferris 0 2 4 8 14 16 18 20 6 10 12 Performance Top Products In Segment Name Market Share Units Sold to Seg Revision Date Stock Out Pfmn Coord Size Coord List Price MTBF Age Dec. 31 Promo Budget Ebb Acre Bead Bottle Fast Baker Eat Able 27% 24% 19% 16% 7% 6% 0% 0% 4,233 3,755 3,025 2,520 1,061 963 14 10 22-Jan-16 25-May-07 16-Sep-16 4-Aug-16 29-Jan-14 10-Jul-16 23-Sep-16 28-May-16 4.0 3.0 4.5 4.8 5.4 7.3 8.0 8.0 16.0 17.0 16.3 15.8 14.6 12.0 12.2 12.0 $20.00 $18.50 $20.50 $19.50 $22.00 $23.50 $26.00 $25.00 17000 14000 14000 17000 17000 17000 16000 16500 5.3 9.6 4.9 1.6 6.4 3.1 1.6 1.6 $1,100 $1,400 $500 $500 $300 $500 $1.100 $1,400 Custome Decemb Sales r er Budget Awarene Custome SS r Survey $1,175 84% 18 $2,500 100% 19 $10 72% 10 $500 47% 12 $300 19% 6 $200 67% 0 $1,200 84% 0 $2,500 100% 0 YES YES YES Market Segment Analysis CAPSTONE COURIER C40642 Round 5, 12/31/2016 High End Accessibility Statistics Total Industry Unit Demand Actual Industry Unit Sales Segment % of Total Industry Growth Rate Next Year 5,410 5,410 13.0% 16.2% Andrews Baldwin Chester Digby 1. Ideal Position 2. Age 3. Reliability 4. Price Customer Buying Criteria Expectations Pfmn 13.4 Size 6.6 Ideal Age = 0.0 MTBF 20000-25000 $27.50 - 37.50 Importance 43% 29% 19% 9% Erie Ferris 0% 20% 40% 60% 80% 100% 20 Actual Market Share Actual Vs. Potential 18 Potential 50% 16 45% 14 40% 35% Size 12 30% 10 25% 8 20% Baganfista 6 15% 10% 4 5% 2 0% Andrews Baldwin Chester Digby Erie Ferris 0 2 4 6 10 12 14 16 18 20 8 Performance Top Products In Segment Name Market Share Units Sold to Seg Revision Date Stock Out Pfmn Coord Size Coord List Price MTBF Age Dec. 31 Promo Budget YES Dixie Adam Cash Cid Axxa Dale Fist Bid Base 24% 19% 16% 11% 7% 7% 6% 5% 5% 1,302 1,015 888 580 396 371 308 292 258 6-Oct-16 24-Jul-16 23-Aug-16 4-Jul-16 2-Jun-16 14-May-16 19-Nov-16 - 4-Sep-16 15-Oct-16 YES YES YES YES 13.4 12.6 13.4 13.4 13.2 13.4 12.5 13.0 12.1 6.6 7.4 6.6 6.6 6.8 6.6 7.5 7.3 7.0 $37.00 $37.00 $37.50 $37.50 $36.75 $37.00 $37.50 $37.00 $37.50 25000 23500 25000 23000 23500 25000 24000 25000 25000 1.3 1.4 1.2 1.8 1.0 0.6 1.2 2.6 1.8 $1,500 $1,400 $1.750 $1,400 $2,000 $1,500 Custome Decemb Sales r er Budget Awarene Custome SS r Survey $2,500 100% 67 $2.500 100% 47 $1,200 98% 61 $1,200 100% 43 $2,500 95% 63 $2,500 61% 64 $850 53% 22 $200 68% 29 $200 69% 29 $1,000 $300 $300 Market Segment Analysis CAPSTONE COURIER C40642 Round 5, 12/31/2016 Performance Accessibility Statistics Total Industry Unit Demand Actual Industry Unit Sales Segment % of Total Industry Growth Rate Next Year Andrews 4,726 4,726 11.3% 19.8% Baldwin Chester Digby Customer Buying Criteria Expectations MTBF 22000-27000 Pfmn 14.4 Size 12.5 $22.50 -32.50 Ideal Age = 1.0 1. Reliability 2. Ideal Position 3. Price 4. Age Importance 43% 29% 19% 9% Erie Ferris 0% 20% 40% 60% 8096 100% 20 Market Share Actual Vs. Potential Actual Potential 18 50% 16 45% 14 40% FGAN 35% Size 12 30% % 10 25% 8 20% 6 15% 10% 4 5% 2 0% Andrews Baldwin Chester Digby Erie Ferris 0 2 4 12 14 16 18 20 6 8 10 Performance Top Products In Segment Units Sold to Revision Date Name Market Share Stock Out Pfmn Coord Size Coord List Price MTBF Age Dec. 31 Promo Budget Seg Aft Anna 20% 20% 18% 17% 13% 9% 3% Dot Coat Bold Cool Foam 943 930 870 811 606 437 129 23-Jul-16 29-Jun-16 28-Sep-16 9-Jul-16 23-Jul-16 10-Apr-16 11-Oct-16 14.4 14.2 14.4 14.4 14.3 13.6 13.4 12.5 12.7 12.5 12.5 12.4 13.0 12.8 $32.00 $32.25 $32.00 $32.25 $31.50 $32.25 $33.00 27000 27000 27000 27000 27000 27000 24000 1.4 1.4 1.3 1.5 1.6 0.7 1.3 Custome Decemb Sales r er Budget Awarene Custome SS r Survey $2,500 100% 72 $2,500 100% 71 $4,500 100% 69 $2,250 100% 62 $500 87% 47 $0 70% 44 $850 53% 12 $1,400 $1,400 $1,500 $1,400 $1,000 $2,000 $1,000 Market Segment Analysis CAPSTONE COURIER C40642 Round 5, 12/31/2016 Size Accessibility Statistics Total Industry Unit Demand Actual Industry Unit Sales Segment % of Total Industry Growth Rate Next Year 4,596 4,596 11.0% 18.3% Andrews Baldwin Chester Digby Customer Buying Criteria Expectations Pfmn 7.5 Size 5.6 Ideal Age = 1.5 MTBF 16000-21000 $22.50 -32.50 = 1. Ideal Position 2. Age 3. Reliability 4. Price Importance 43% 29% 19% 9% Erie Ferris 0% 20% 40% 60% 80% 100% 20 Market Share Actual Vs. Potential Actual Potential 18 50% 16 45% 14 40% 35% Size 12 30% 10 25% 8 20% % Buddy FOopee Athe 6 15% 10% 4 5% 2 0% Andrews Baldwin Chester Digby Erie Ferris 0 2 4 8 12 14 16 18 20 6 10 Performance Top Products In Segment Units Sold to Revision Date Name Market Share Stock Out Pfmn Coord Size Coord List Price MTBF Age Dec.31 Promo Budget Seg YES Cure Agape Abba Dune Code Fume Buddy 24% 23% 21% 18% 11% 3% 1% 1,097 1,038 954 827 491 140 49 26-Jun-16 22-Jun-16 30-Jun-16 28-Sep-16 23-Feb-16 19-Nov-16 1-Mar-17 7.5 7.4 7.3 7.5 6.9 6.5 5.5 YES 5.6 5.7 5.8 5.6 6.4 6.4 7.9 $32.50 $33.00 $32.50 $32.00 $32.50 $33.00 $32.00 21000 19500 18000 21000 19000 18000 19000 1.5 1.5 1.3 1.4 0.9 1.3 4.4 Custome Decemb Sales r er Budget Awarene Custome SS r Survey $2,250 100% 77 $2,500 100% 69 $2,500 100% 65 100% 83 $0 70% 30 $850 53% 14 $1,000 52% 2 $1,400 $1,400 $2,000 $1,500 $2,000 $1,000 $1,000 $ $4,500 Market Share C34283 50% 40% 30% 20% ht 10% 0% Andrews Erie Baldwin Chester Digby Ferris Trad I Low High Pfmn Size HR/TQM Report CAPSTONE COURIER Round 5, 12/31/2016 Erie Chester 620 Digby 233 Ferris 339 823 616 233 823 339 538 440 195 193 40 144 78 0.7% 382 0.07. 0.07 6.87 95 0.0% 100% 7.0% 10.0% 213 206 34 0 44 0 $0 $0 HUMAN RESOURCES SUMMARY Andrews Baldwin Needed Complement 1,607 929 Complement 1,608 929 1st Shift Complement 957 648 2nd Shift Complement 651 281 Overtime% 0.0% 0.0% Turnover Rate 6.4% 6.6% New Employees 109 61 Separated Employees 0 421 Recruiting Spend $4,000 $1,500 Training Hours 80 80 Productivity Index 1.18 1.13 Recruiting Cost $543 $154 Separation Cost $0 $2,105 Training Cost $2,573 $1,486 Total HR Admin Costs $3,116 $3,745 Labor Contract Next Year Wages $26.81 $26.81 Benefits $2.500 $2,500 Profit Sharing 2.07 2.0% Wage Escalator 5.0% 5.07 0 $5,000 80 1.12 $0 0 80 1.06 100 1.00 $570 $213 $34 $0 $0 $206 $0 $986 $1,192 $373 $222 $0 $256 $942 $213 $26.81 $2,500 $26.81 $2,500 $26.81 $2,500 $26.81 $2,500 2.0% % 5.07 2.0% 5.02 2.0% 5.07. 2.07 5.02 Page 11 Annual Report Baldwin Bid $10,811 Bold $19,077 Buddy $1,569 Base $9,666 Bottle $49,145 2016 Bna Total $0 ####### Common 2015 Size 100.02 ####### 2016 Income Statement Product Name Baker Bead Sales $29,176 $62,010 Variable Costs Direct Labor $9,713 $22,450 Direct Material $8,801 $15.320 Inventory Carry $0 $672 Total Variable Costs $18,513 $38,442 Contribution Margin $10,663 $23,567 Period Costs Depreciation $3.173 $3,733 SG&A: R&D $533 $719 Promotions $500 $500 Sales $200 $10 Admin $785 $1.669 Total Period Costs $5,192 $6.632 Net Margin $5,471 $16,935 $2,649 $4,193 $640 $7,482 $3,329 $ $4,760 $8,795 $239 $13,795 $5,282 $476 $515 $408 $1,398 $170 $2,350 $3,698 $680 $6,728 $2,938 $23,721 $15,652 $473 $39,846 $9,299 $0 $66,119 $0 $56,973 $3.112 $0 ####### $0 $55.248 36.42 $68,347 31.42 $60,022 1.77 $5.200 69.67####### 30.42 $65,835 $733 $688 $300 $200 $291 $2,212 $1.117 $960 $568 $1,000 $500 $514 $3,542 $1,740 $400 $1,000 $1,000 $1,000 $42 $3,442 ($3,272) $587 $802 $300 $200 $260 $2,149 $789 $2,240 $600 $500 $500 $1.323 $5,163 $4.135 $0 $11,827 $0 $4,911 $0 $4,100 $0 $2,610 $4.884 $0 $28,333 $0 $26,916 6.54 $12,053 2.74 $4,780 2.32 $10,200 1.47 $11,500 2.77 $5.392 15.67 $43.926 14.87 $21,909 Other EBIT Short Term Interest Long Term Interest Taxes Profit Sharing Net Profit $8,542 $18,374 $2,286 $9,369 $2,352 $87 $4,280 4.724 $9,050 10.12 $12,859 1.32 $9,546 5.22 $7,194 $ 13% ($1,358) 0.0%. $0 2.4% ($2,523) Andrew's product manager is considering lowering the price of Acre by $2.50 and wants to know what the impact will be on the product's contribution margin. Assuming no inventory carrying costs, what will Acre's contribution margin be if the price is lowered? O 37.56% O 23.25% O 27.81% 11.55% O 43.44% Demand is created through meeting customer buying criteria, credit terms, awareness (promotion) and accessibility (distribution). According to the December Customer Survey, which of these products was the most competitive at the end of the year in the low end market? Bead O Bottle O Fast O Ebb O Acre Andrews currently has $3,434 (000) in cash. Assuming this year's cash from operations will remain unchanged, and the most capital the company can raise is $15,000 (000), what activity exposes the company to the most risk of being issued and emergency loan? O Retiring the oldest bond O Issuing a $2.00 dividend O Purchasing $30,000 (000) worth of plant and equipment O Getting rid of all the inventory Which description best fits Erie in your industry? Refer to the Market Share Report in the Courier. --A differentiator competes through good designs, high awareness, and easy accessibility -- A cost leader competes on price by reducing costs and passing the savings to customers --A broad player competes an all parts of the market. --A niche player competes in selected parts of the market. Erie is a niche cost leader O Erie is a niche differentiator O Erie is a broad cost leader O Erie is a broad differentiator