Answered step by step
Verified Expert Solution
Link Copied!

Question

1 Approved Answer

please answer all of them right. thank you Intro The following table shows historical beginning-of-year prices for a stock and the sum of dividends paid

please answer all of them right. thank you image text in transcribed
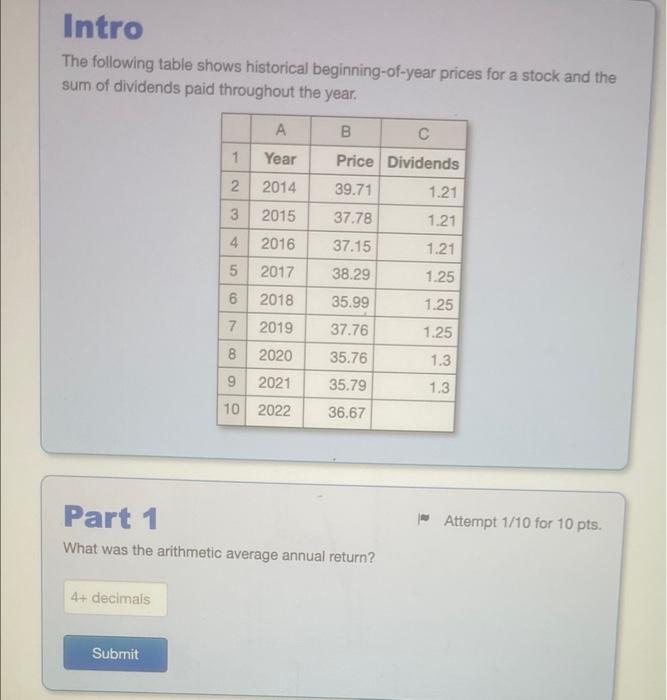
image text in transcribed
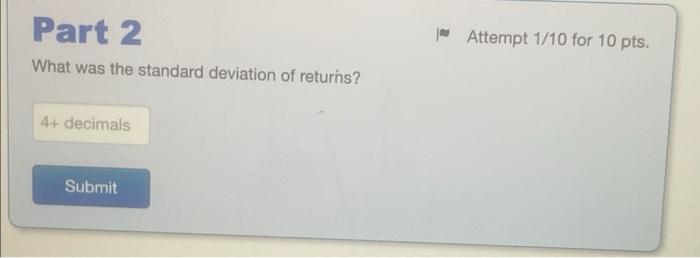
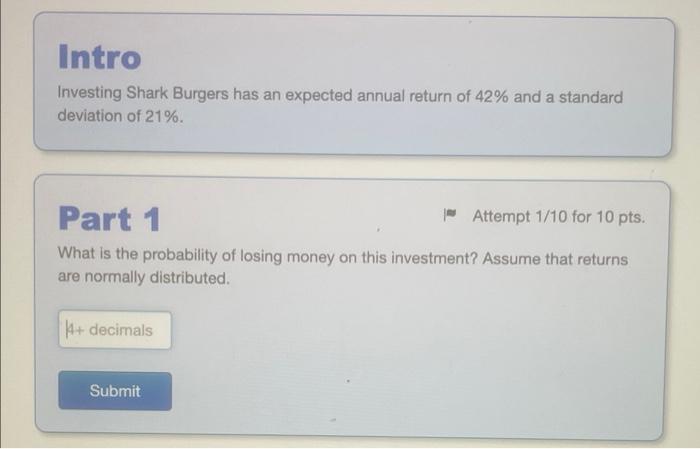
Intro The following table shows historical beginning-of-year prices for a stock and the sum of dividends paid throughout the year. A B 1 Year Price Dividends 39.71 1.21 2 2 2014 2015 3 37.78 1.21 2016 37.15 1.21 5 2017 1.25 38.29 35.99 6 2018 1.25 7 37.76 1.25 2019 2020 8 35.76 1.3 9 2021 35.79 1.3 10 2022 36.67 the Attempt 1/10 for 10 pts. Part 1 What was the arithmetic average annual return? 4+ decimals Submit - Attempt 1/10 for 10 pts. Part 2 What was the standard deviation of returns? 4+ decimals Submit Intro Investing Shark Burgers has an expected annual return of 42% and a standard deviation of 21%. Part 1 Attempt 1/10 for 10 pts. What is the probability of losing money on this investment? Assume that returns are normally distributed. 14+ decimals Submit

Step by Step Solution

There are 3 Steps involved in it

Step: 1

blur-text-image

Get Instant Access to Expert-Tailored Solutions

See step-by-step solutions with expert insights and AI powered tools for academic success

Step: 2

blur-text-image_2

Step: 3

blur-text-image_3

Ace Your Homework with AI

Get the answers you need in no time with our AI-driven, step-by-step assistance

Get Started

Recommended Textbook for

Nft For Beginners

Authors: Maria Medina

1st Edition

979-8851572357

More Books

Students also viewed these Finance questions

Question

2. What are the styles of delivery?

Answered: 1 week ago