Answered step by step
Verified Expert Solution
Question
1 Approved Answer
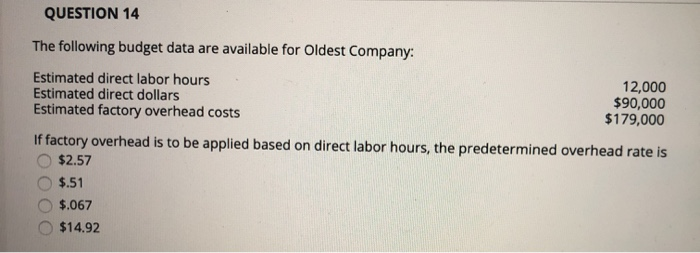
Please answer all of them. thanks QUESTION 14 The following budget data are available for Oldest Company: Estimated direct labor hours 12,000 Estimated direct dollars


Please answer all of them. thanks
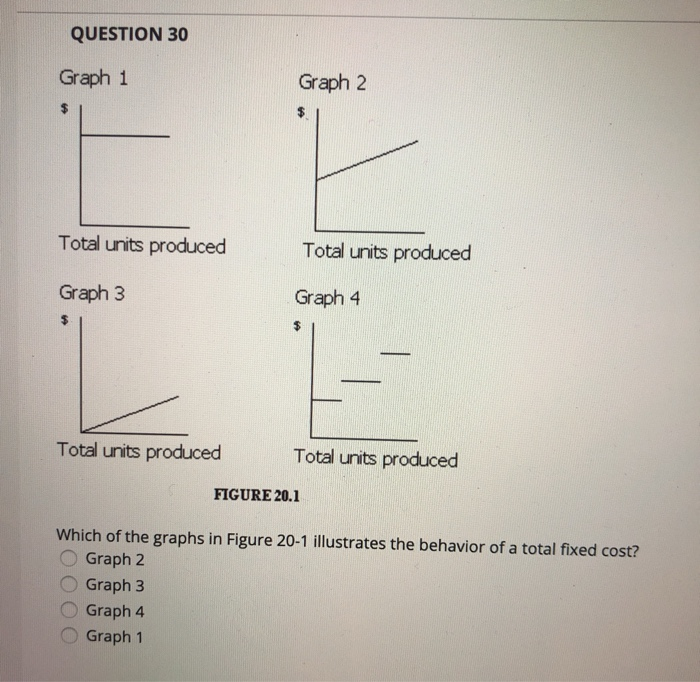
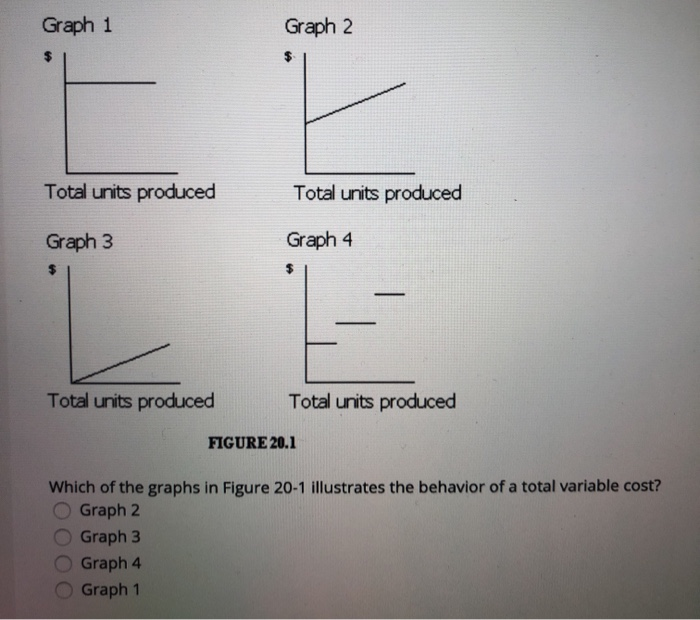
QUESTION 14 The following budget data are available for Oldest Company: Estimated direct labor hours 12,000 Estimated direct dollars $90,000 Estimated factory overhead costs $179,000 If factory overhead is to be applied based on direct labor hours, the predetermined overhead rate is $2.57 $.51 $.067 $14.92 QUESTION 30 Graph 1 Graph 2 Total units produced Total units produced Graph 3 Graph 4 Total units produced Total units produced FIGURE 20.1 Which of the graphs in Figure 20-1 illustrates the behavior of a total fixed cost? O Graph 2 O Graph 3 O Graph 4 Graph 1 Graph 1 Graph 2 Total units produced Total units produced Graph 3 Graph 4 Total units produced Total units produced FIGURE 20.1 Which of the graphs in Figure 20-1 illustrates the behavior of a total variable cost? O Graph 2 O Graph 3 O Graph 4 Graph 1 28. The Marx Company issued $100,000 of 12% bonds on April 1, 2007 at face value. The bond semiannually on January 1 and July 1. The hands are dated January 1, 2007, and mature on January 1, UT us on April 1, 2007 at face value. The bonds pay interest The total interest expense related to these bonds for the year ended December 31, 200 a. $1,000 b. $3,000 c. $9,000 d. 12,000 54. The relationship of $275,000 to $125,000, expressed as a ratio, is a. 2.0 to 1 b. 2.2 to 1 c. 2.5 to 1 d. 0.45 to 1 Step by Step Solution
There are 3 Steps involved in it
Step: 1

Get Instant Access to Expert-Tailored Solutions
See step-by-step solutions with expert insights and AI powered tools for academic success
Step: 2

Step: 3

Ace Your Homework with AI
Get the answers you need in no time with our AI-driven, step-by-step assistance
Get Started


