

Answered step by step
Verified Expert Solution
Question
1 Approved Answer
Please answer all parts After graduating from college in May 2018, Ryan Crews started his career in finance at the W&T Corporation, a small- to
Please answer all parts
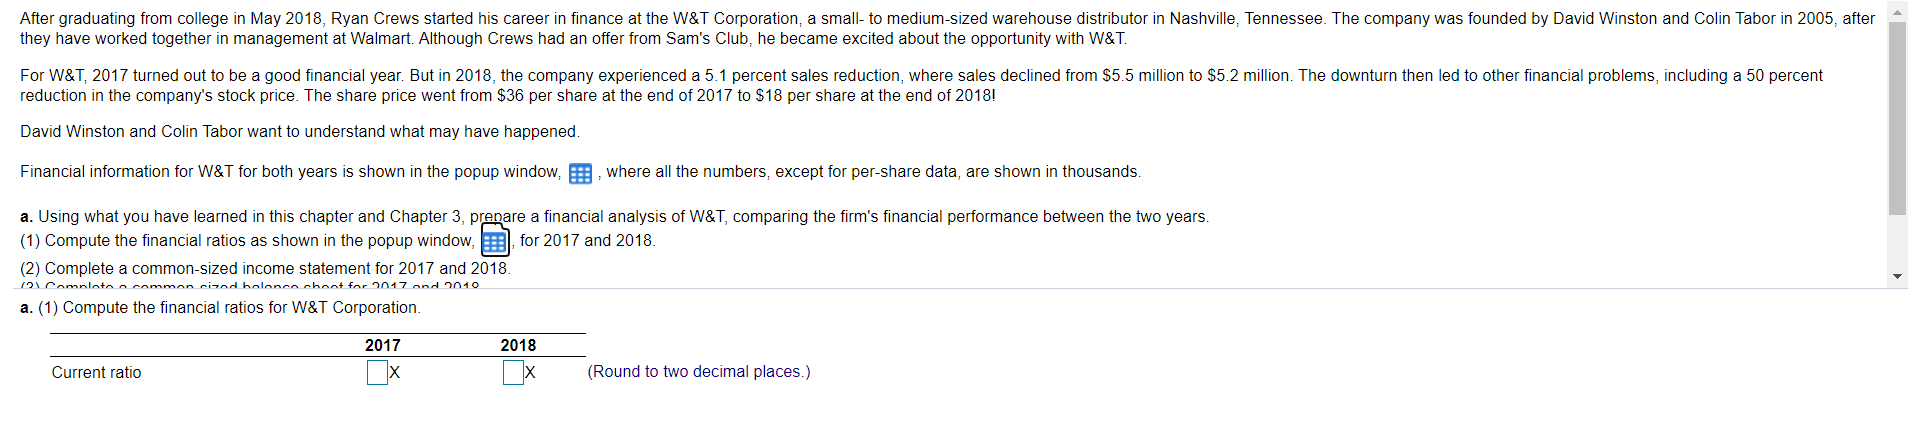
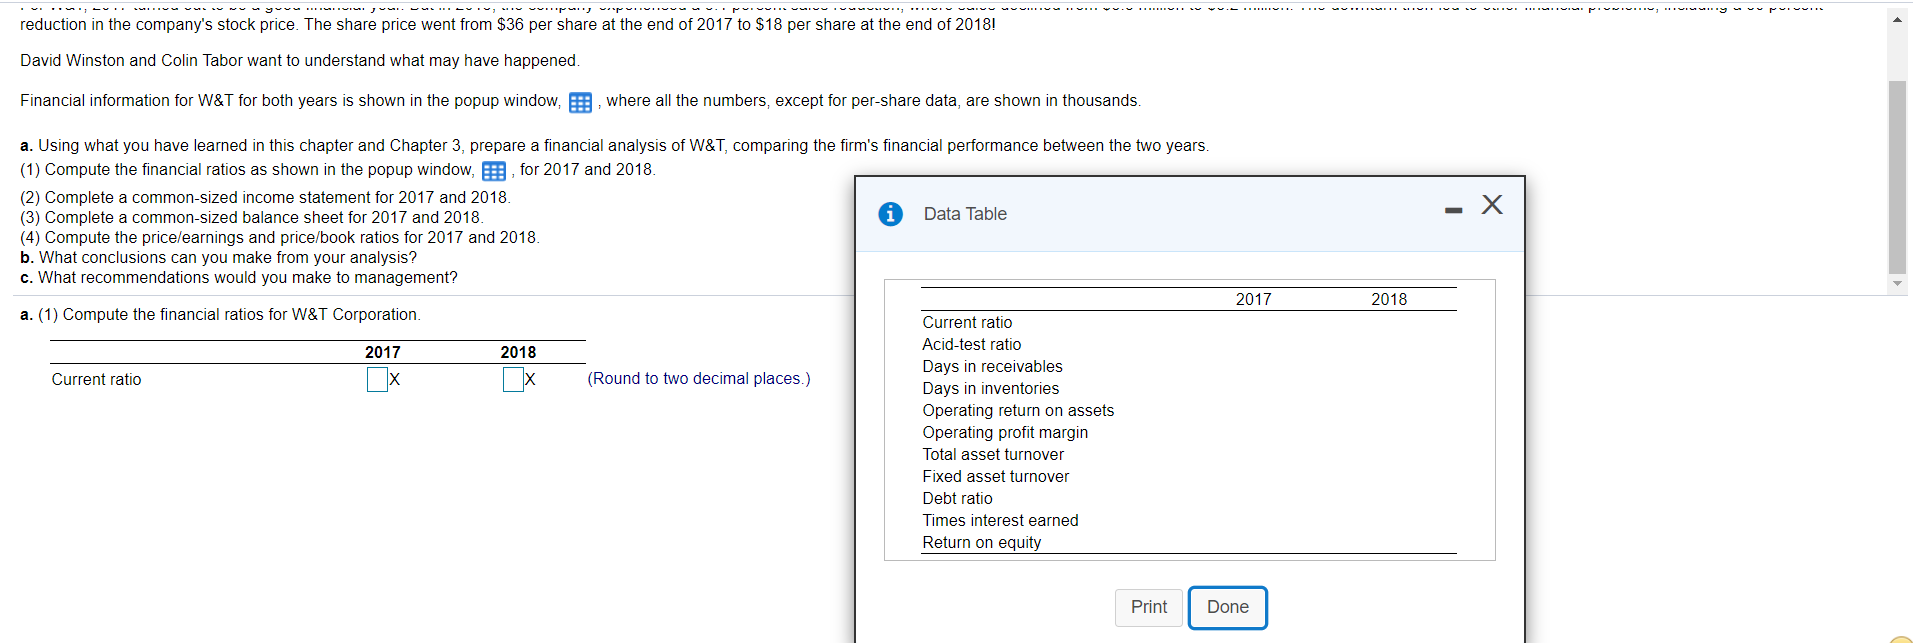
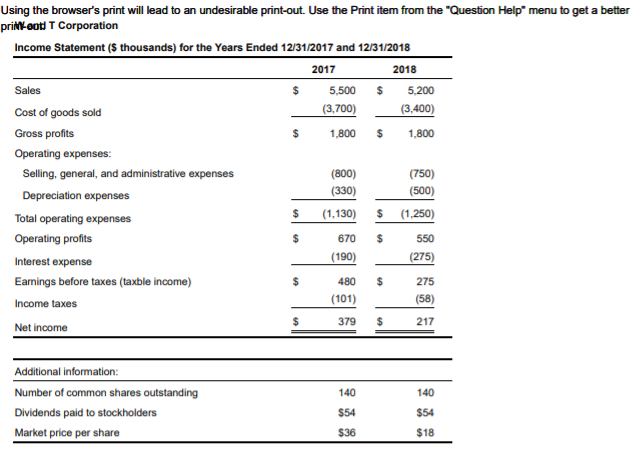
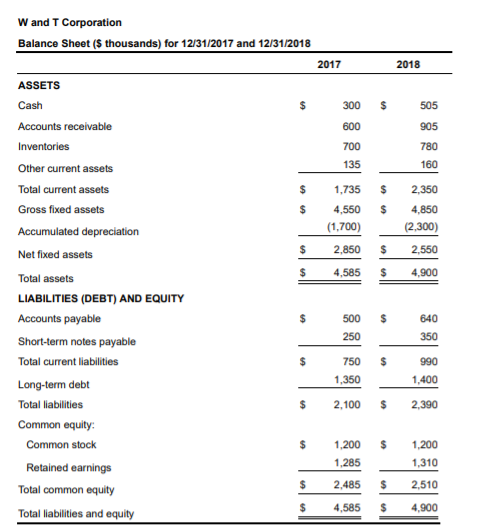
After graduating from college in May 2018, Ryan Crews started his career in finance at the W&T Corporation, a small- to medium-sized warehouse distributor in Nashville, Tennessee. The company was founded by David Winston and Colin Tabor in 2005, after they have worked together in management at Walmart. Although Crews had an offer from Sam's Club, he became excited about the opportunity with W&T. For W&T, 2017 turned out to be a good financial year. But in 2018, the company experienced a 5.1 percent sales reduction, where sales declined from $5.5 million to $5.2 million. The downturn then led to other financial problems, including a 50 percent reduction in the company's stock price. The share price went from $36 per share at the end of 2017 to $18 per share at the end of 2018! David Winston and Colin Tabor want to understand what may have happened. Financial information for W&T for both years is shown in the popup window, , where all the numbers, except for per-share data, are shown in thousands. a. Using what you have learned in this chapter and Chapter 3, prepare a financial analysis of W&T, comparing the firm's financial performance between the two years. (1) Compute the financial ratios as shown in the popup window, for 2017 and 2018. (2) Complete a common-sized income statement for 2017 and 2018. 121 camoloto common cizod boloncacboot for 2017 and 2010 a. (1) Compute the financial ratios for W&T Corporation. 2017 2018 Current ratio (Round to two decimal places.) reduction in the company's stock price. The share price went from $36 per share at the end of 2017 to $18 per share at the end of 2018! David Winston and Colin Tabor want to understand what may have happened. Financial information for W&T for both years is shown in the popup window, B, where all the numbers, except for per-share data, are shown in thousands a. Using what you have learned in this chapter and Chapter 3, prepare a financial analysis of W&T, comparing the firm's financial performance between the two years. (1) Compute the financial ratios as shown in the popup window, E, for 2017 and 2018. (2) Complete a common-sized income statement for 2017 and 2018. (3) Complete a common-sized balance sheet for 2017 and 2018 Data Table (4) Compute the pricelearnings and price/book ratios for 2017 and 2018. b. What conclusions can you make from your analysis? c. What recommendations would you make to management? 2017 2018 a. (1) Compute the financial ratios for W&T Corporation. 2017 2018 Current ratio Ox (Round to two decimal places.) Current ratio Acid-test ratio Days in receivables Days in inventories Operating return on assets Operating profit margin Total asset turnover Fixed asset turnover Debt ratio Times interest earned Return on equity Print Done Using the browser's print will lead to an undesirable print-out. Use the Print item from the "Question Help" menu to get a better prikoot T Corporation Income Statement (s thousands) for the Years Ended 12/31/2017 and 12/31/2018 2017 2018 Sales $ 5,500 $ 5,200 Cost of goods sold (3,700) (3,400) Gross profits 1.800 $ 1.800 Operating expenses: Selling, general, and administrative expenses (800) (750) Depreciation expenses (330) (500) Total operating expenses (1,130) $ (1,250) Operating profits $ 670 $ 550 Interest expense (190) (275) Earnings before taxes (taxble income) $ 275 Income taxes (101) (58) Net income $ $ 480 379 217 140 140 Additional information: Number of common shares outstanding Dividends paid to stockholders Market price per share $54 $54 $36 $18 W and T Corporation Balance Sheet (s thousands) for 12/31/2017 and 12/31/2018 2017 2018 $ 300 600 700 505 905 780 135 160 $ 2,350 1,735 4,550 (1.700) $ $ $ 4,850 (2.300) $ 2,850 2,550 $ 4,585 $ 4,900 ASSETS Cash Accounts receivable Inventories Other current assets Total current assets Gross fixed assets Accumulated depreciation Net fixed assets Total assets LIABILITIES (DEBT) AND EQUITY Accounts payable Short-term notes payable Total current liabilities Long-term debt Total liabilities Common equity: Common stock Retained earnings Total common equity Total liabilities and equity $ 500 250 640 350 750 $ 990 1,350 1,400 $ 2.100 $ 2,390 $ 1,200 $ 1.200 1,310 1.285 $ 2,485 $ 2,510 $ 4,585 $ 4,900 After graduating from college in May 2018, Ryan Crews started his career in finance at the W&T Corporation, a small- to medium-sized warehouse distributor in Nashville, Tennessee. The company was founded by David Winston and Colin Tabor in 2005, after they have worked together in management at Walmart. Although Crews had an offer from Sam's Club, he became excited about the opportunity with W&T. For W&T, 2017 turned out to be a good financial year. But in 2018, the company experienced a 5.1 percent sales reduction, where sales declined from $5.5 million to $5.2 million. The downturn then led to other financial problems, including a 50 percent reduction in the company's stock price. The share price went from $36 per share at the end of 2017 to $18 per share at the end of 2018! David Winston and Colin Tabor want to understand what may have happened. Financial information for W&T for both years is shown in the popup window, , where all the numbers, except for per-share data, are shown in thousands. a. Using what you have learned in this chapter and Chapter 3, prepare a financial analysis of W&T, comparing the firm's financial performance between the two years. (1) Compute the financial ratios as shown in the popup window, for 2017 and 2018. (2) Complete a common-sized income statement for 2017 and 2018. 121 camoloto common cizod boloncacboot for 2017 and 2010 a. (1) Compute the financial ratios for W&T Corporation. 2017 2018 Current ratio (Round to two decimal places.) reduction in the company's stock price. The share price went from $36 per share at the end of 2017 to $18 per share at the end of 2018! David Winston and Colin Tabor want to understand what may have happened. Financial information for W&T for both years is shown in the popup window, B, where all the numbers, except for per-share data, are shown in thousands a. Using what you have learned in this chapter and Chapter 3, prepare a financial analysis of W&T, comparing the firm's financial performance between the two years. (1) Compute the financial ratios as shown in the popup window, E, for 2017 and 2018. (2) Complete a common-sized income statement for 2017 and 2018. (3) Complete a common-sized balance sheet for 2017 and 2018 Data Table (4) Compute the pricelearnings and price/book ratios for 2017 and 2018. b. What conclusions can you make from your analysis? c. What recommendations would you make to management? 2017 2018 a. (1) Compute the financial ratios for W&T Corporation. 2017 2018 Current ratio Ox (Round to two decimal places.) Current ratio Acid-test ratio Days in receivables Days in inventories Operating return on assets Operating profit margin Total asset turnover Fixed asset turnover Debt ratio Times interest earned Return on equity Print Done Using the browser's print will lead to an undesirable print-out. Use the Print item from the "Question Help" menu to get a better prikoot T Corporation Income Statement (s thousands) for the Years Ended 12/31/2017 and 12/31/2018 2017 2018 Sales $ 5,500 $ 5,200 Cost of goods sold (3,700) (3,400) Gross profits 1.800 $ 1.800 Operating expenses: Selling, general, and administrative expenses (800) (750) Depreciation expenses (330) (500) Total operating expenses (1,130) $ (1,250) Operating profits $ 670 $ 550 Interest expense (190) (275) Earnings before taxes (taxble income) $ 275 Income taxes (101) (58) Net income $ $ 480 379 217 140 140 Additional information: Number of common shares outstanding Dividends paid to stockholders Market price per share $54 $54 $36 $18 W and T Corporation Balance Sheet (s thousands) for 12/31/2017 and 12/31/2018 2017 2018 $ 300 600 700 505 905 780 135 160 $ 2,350 1,735 4,550 (1.700) $ $ $ 4,850 (2.300) $ 2,850 2,550 $ 4,585 $ 4,900 ASSETS Cash Accounts receivable Inventories Other current assets Total current assets Gross fixed assets Accumulated depreciation Net fixed assets Total assets LIABILITIES (DEBT) AND EQUITY Accounts payable Short-term notes payable Total current liabilities Long-term debt Total liabilities Common equity: Common stock Retained earnings Total common equity Total liabilities and equity $ 500 250 640 350 750 $ 990 1,350 1,400 $ 2.100 $ 2,390 $ 1,200 $ 1.200 1,310 1.285 $ 2,485 $ 2,510 $ 4,585 $ 4,900Step by Step Solution
There are 3 Steps involved in it
Step: 1

Get Instant Access to Expert-Tailored Solutions
See step-by-step solutions with expert insights and AI powered tools for academic success
Step: 2

Step: 3
Ace Your Homework with AI
Get the answers you need in no time with our AI-driven, step-by-step assistance
Get Started
Passive Income Stacking Handbook How To Reach Financial Freedom Faster Regardless Of Your Age Or Situation
Authors: Mark Walters
1st Edition
0578530171, 978-0578530178