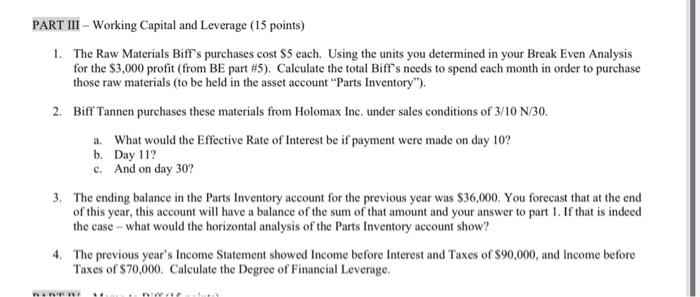
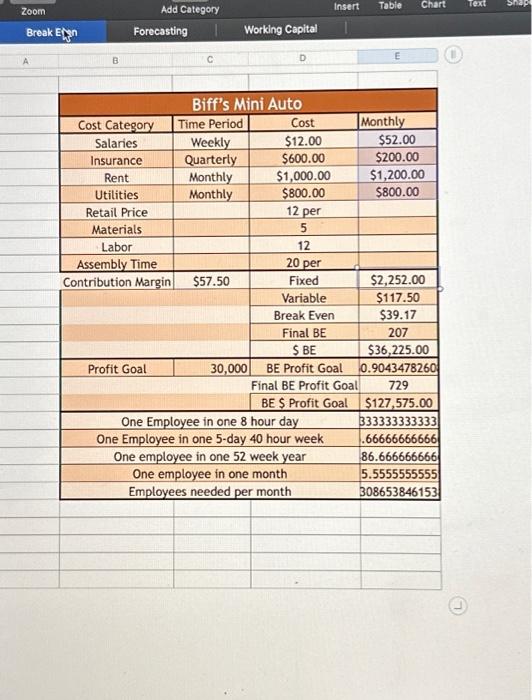
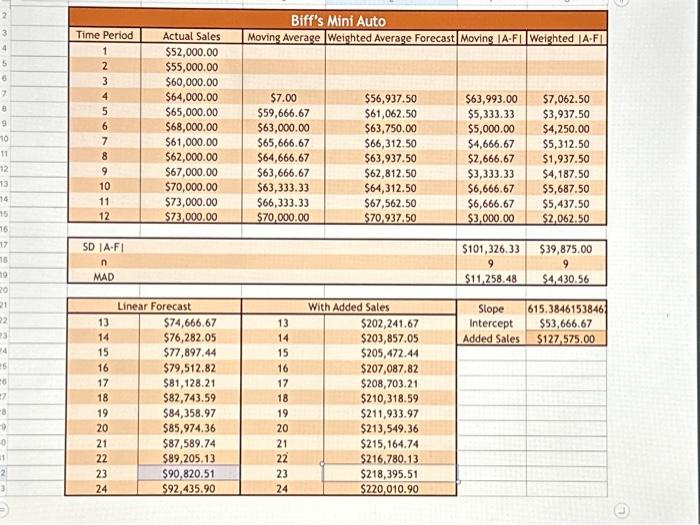
please answer all parts and questions, thank you !!with breakeven table and forecasting table

1. The Raw Materials Biff's purchases cost $5 each. Using the units you determined in your Break Even Analysis for the $3,000 profit (from BE part \#5). Calculate the total Biff's needs to spend each month in order to purchase those raw materials (to be held in the asset account "Parts Inventory"). 2. Biff Tannen purchases these materials from Holomax Inc. under sales conditions of 3/10N/30. a. What would the Effective Rate of Interest be if payment were made on day 10 ? b. Day 11 ? c. And on day 30 ? 3. The ending balance in the Parts Inventory account for the previous year was $36,000. You forecast that at the end of this year, this account will have a balance of the sum of that amount and your answer to part 1. If that is indeed the case - what would the horizontal analysis of the Parts Inventory account show? 4. The previous year's Income Statement showed Income before Interest and Taxes of $90,000, and Income before Taxes of \$70,000. Calculate the Degree of Financial Leverage. Zoom Add Category Forecasting Working Capital \begin{tabular}{|c|c|c|c|c|c|c|} \hline 2 & \multicolumn{6}{|c|}{ Biff's Mini Auto } \\ \hline 3 & Time Period & Actual Sales & Moving Average & Weighted Average Forecast & Moving AF & Weighted AF \\ \hline 4 & 1 & $52,000.00 & & & & \\ \hline 5 & 2 & $55,000,00 & & & & \\ \hline 6 & 3 & $60,000,00 & & & & \\ \hline 7 & 4 & $64,000.00 & $7.00 & $56,937.50 & $63,993.00 & $7,062.50 \\ \hline & 5 & $65,000.00 & $59,666.67 & $61,062.50 & $5,333.33 & $3,937.50 \\ \hline 9 & 6 & $68,000.00 & $63,000.00 & $63,750,00 & $5,000,00 & $4,250.00 \\ \hline 10 & 7 & $61,000.00 & $65,666.67 & $66,312,50 & $4,666.67 & $5,312.50 \\ \hline 11 & 8 & $62,000.00 & $64,666.67 & $63,937.50 & $2,666.67 & $1,937.50 \\ \hline 12. & 9 & $67,000.00 & $63,666.67 & $62,812.50 & $3,333.33 & $4,187.50 \\ \hline 13 & 10 & $70,000.00 & $63,333.33 & $64,312.50 & $6,666.67 & $5,687.50 \\ \hline 14 & 11 & $73,000.00 & $66,333.33 & $67,562.50 & $6,666.67 & $5,437.50 \\ \hline 15 & 12 & $73,000,00 & $70,000,00 & $70,937,50 & $3,000.00 & $2,062.50 \\ \hline \multicolumn{7}{|r|}{x+1,04} \\ \hline 17 & SD AF & & & & $101,326.33 & $39,875.00 \\ \hline 18 & n & & & & 9 & 9 \\ \hline 19 & MAD & & & & $11,258,48 & $4,430.56 \\ \hline 20 & & & & & & \\ \hline 21 & \multicolumn{2}{|c|}{ Linear Forecast } & \multicolumn{2}{|c|}{ With Added Sales } & Slope & 615.3846153846 \\ \hline 22 & 13 & $74,666.67 & 13 & $202,241.67 & Intercept & $53,666.67 \\ \hline 3 & 14 & $76,282.05 & 14 & $203,857,05 & Added Sales & $127,575.00 \\ \hline 4 & 15 & $77,897,44 & 15 & $205,472,44 & & \\ \hline 15 & 16 & $79,512.82 & 16 & $207,087,82 & & \\ \hline 6 & 17 & $81,128.21 & 17 & $208,703.21 & & \\ \hline 7 & 18 & $82,743.59 & 18 & $210,318.59 & & \\ \hline 6 & 19 & $84,358.97 & 19 & $211,933.97 & & \\ \hline 9 & 20 & $85,974.36 & 20 & $213,549.36 & & \\ \hline 0 & 21 & $87,589.74 & 21 & $215,164.74 & & \\ \hline 1 & 22 & $89,205.13 & 22 & $216,780,13 & & \\ \hline 2 & 23 & $90,820.51 & 23 & $218,395.51 & & \\ \hline 3 & 24 & $92,435.90 & 24 & $220,010.90 & & \\ \hline \end{tabular}


