Please answer all parts and show your work. Answers done in Microsoft Excel preferred. Thanks!

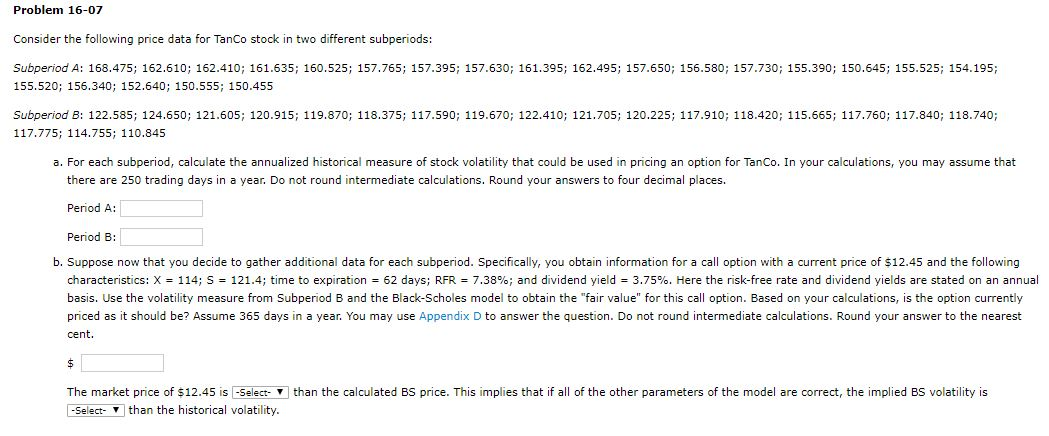
Problem 16-07 Consider the following price data for TanCo stock in two different subperiods: Subperiod A: 168.475; 162.610; 162.410; 161.635; 160.525; 157.765; 157.395; 157.630; 161.395; 162.495; 157.650; 156.580; 157.730; 155.390; 150.645; 155.525; 154.195; 155.520; 156.340; 152.640; 150.555; 150.455 Subperiod B: 122.585; 124.650; 121.605; 120.915; 119.870; 118.375; 117.590; 119.670; 122.410; 121.705; 120.225; 117.910; 118.420; 115.665; 117.760; 117.840; 118.740; 117.775; 114.755; 110.845 a. For each subperiod, calculate the annualized historical measure of stock volatility that could be used in pricing an option for TanCo. In your calculations, you may assume that there are 250 trading days in a year. Do not round intermediate calculations. Round your answers to four decimal places. Period A: Period B: b. Suppose now that you decide to gather additional data for each subperiod. Specifically, you obtain information for a call option with a current price of $12.45 and the following characteristics: X = 114; S = 121.4; time to expiration = 62 days; RFR = 7.38%; and dividend yield = 3.75%. Here the risk-free rate and dividend yields are stated on an annual basis. Use the volatility measure from Subperiod B and the Black-Scholes model to obtain the "fair value" for this call option. Based on your calculations, is the option currently priced as it should be? Assume 365 days in a year. You may use Appendix D to answer the question. Do not round intermediate calculations. Round your answer to the nearest cent. than the calculated BS price. This implies that if all of the other parameters of the model are correct, the implied BS volatility is The market price of $12.45 is -Select- -Select- than the historical volatility. Problem 16-07 Consider the following price data for TanCo stock in two different subperiods: Subperiod A: 168.475; 162.610; 162.410; 161.635; 160.525; 157.765; 157.395; 157.630; 161.395; 162.495; 157.650; 156.580; 157.730; 155.390; 150.645; 155.525; 154.195; 155.520; 156.340; 152.640; 150.555; 150.455 Subperiod B: 122.585; 124.650; 121.605; 120.915; 119.870; 118.375; 117.590; 119.670; 122.410; 121.705; 120.225; 117.910; 118.420; 115.665; 117.760; 117.840; 118.740; 117.775; 114.755; 110.845 a. For each subperiod, calculate the annualized historical measure of stock volatility that could be used in pricing an option for TanCo. In your calculations, you may assume that there are 250 trading days in a year. Do not round intermediate calculations. Round your answers to four decimal places. Period A: Period B: b. Suppose now that you decide to gather additional data for each subperiod. Specifically, you obtain information for a call option with a current price of $12.45 and the following characteristics: X = 114; S = 121.4; time to expiration = 62 days; RFR = 7.38%; and dividend yield = 3.75%. Here the risk-free rate and dividend yields are stated on an annual basis. Use the volatility measure from Subperiod B and the Black-Scholes model to obtain the "fair value" for this call option. Based on your calculations, is the option currently priced as it should be? Assume 365 days in a year. You may use Appendix D to answer the question. Do not round intermediate calculations. Round your answer to the nearest cent. than the calculated BS price. This implies that if all of the other parameters of the model are correct, the implied BS volatility is The market price of $12.45 is -Select- -Select- than the historical volatility


