Answered step by step
Verified Expert Solution
Question
1 Approved Answer
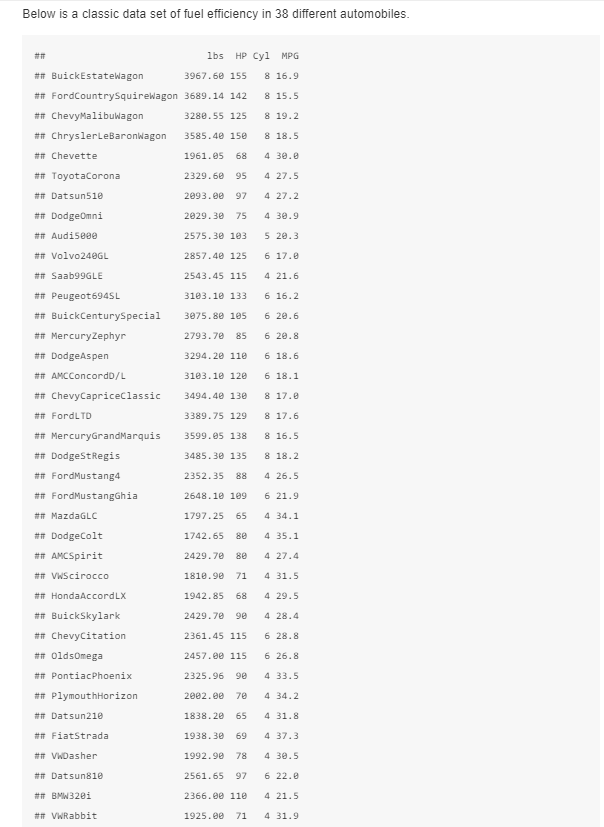
Please answer all parts! Below is a classic data set of fuel efficiency in 38 different automobiles. ## lbs HP Cyl MPG ## BuickEstatewagon 3967.60


Please answer all parts!
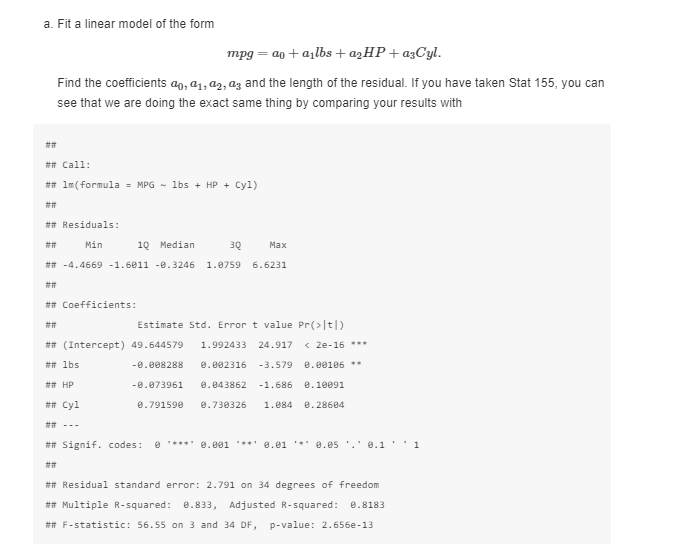
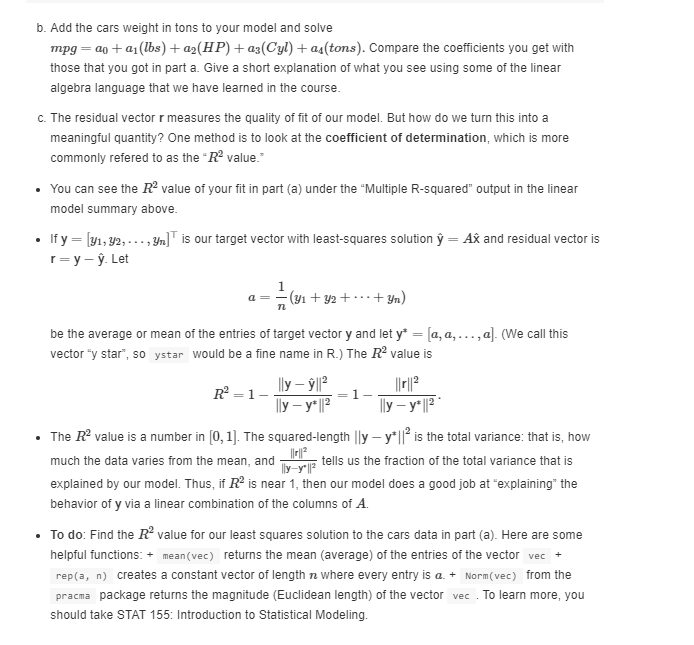
Below is a classic data set of fuel efficiency in 38 different automobiles. ## lbs HP Cyl MPG ## BuickEstatewagon 3967.60 155 8 16.9 ## FordCountrySquirewagon 3689.14 142 8 15.5 ## ChevyMalibuwagon 3288.55 125 8 19.2 ## ChryslerleBaronwagon 3585.49 150 8 18.5 ## Chevette 1961.05 68 4 30. ## ToyotaCorona 2329.60 95 4 27.5 ## Datsun 51e 2093.ee 97 4 27.2 ## DodgeOmni 2029.30 75 4 30.9 ## Audi5800 2575.30 103 5 20.3 ## Volvo 240GL 2857.40 125 6 17.0 ## Saab99GLE 2543.45 115 4 21.6 3103.10 133 6 16.2 ## Peugeot 694SL ## BuickCenturySpecial ## Mercury Zephyr 3075.80 105 6 20.6 2793.70 85 6 20.8 ## Dodge Aspen 3294.20 110 6 18.6 3103.10 120 6 18.1 ## AMC ConcordD/L ## ChevyCapriceclassic ## FordLTD 3494.40 130 8 17.0 3389.75 129 8 17.6 3599.05 138 8 16.5 3485.30 135 8 18.2 2352.35 88 4 26.5 2648.10 109 6 21.9 1797.25 65 4 34.1 1742.65 80 4 35.1 2429.70 80 4 27.4 ## Mercury Grand Marquis # DodgeStRegis ## Ford Mustang ## FordMustangGhia ## MazdaGLC ## DodgeColt ## AMCSpirit ## VWScirocco # Honda AccordLx ## BuickSkylark ## Chevycitation ## OldsOmega ## Pontiac Phoenix ## PlymouthHorizon ## Datsun 210 1819.90 71 4 31.5 1942.85 68 4 29.5 2429.70 90 4 28.4 2361.45 115 6 28.8 2457.00 115 6 26.8 2325.96 90 4 33.5 2002.ee 70 4 34.2 1838.20 65 4 31.8 ## Fiat Strada 1938. 30 69 4 37.3 ## VWDasher 1992.90 78 4 30.5 ## Datsun810 2561.65 97 6 22.0 ## BMW 320i 2366.00 110 4 21.5 ## VwRabbit 1925.00 71 4 31.9 a. Fit a linear model of the form mpg = 20 + a lbs + a2HP + azCyl. Find the coefficients 20, 21, 22, 23 and the length of the residual. If you have taken Stat 155, you can see that we are doing the exact same thing by comparing your results with ## ## Call: ## Im(formula = MPG - lbs + HP + Cyl) #TT ## Residuals: Min 1Q Median 30 Max ## -4.4669 -1.6011 -0.3246 1.0759 6.6231 ## ## Coefficients: Estimate Std. Error t value Pr(>It) #(Intercept) 49.644579 1.992433 24.917 2e-16 # lbs -0.008288 0.892316 -3.579 0.00186 # HP -0.973961 @.843862 -1.686 0.10091 ## Cyl 0.791590 0.730326 1.084 8.28684 # Signif. codes: @ "***@.001 0.01 0.05'. 2.1 1 ## Residual standard error: 2.791 on 34 degrees of freedom ## Multiple R-squared: 0.833, Adjusted R-squared: 0.8183 ## F-statistic: 56.55 on 3 and 34 DF, P-value: 2.656e-13 b. Add the cars weight in tons to your model and solve mpg=20 + a1(lbs) + a2(HP) + 23(Cyl) + a(tons). Compare the coefficients you get with those that you got in part a. Give a short explanation of what you see using some of the linear algebra language that we have learned in the course. c. The residual vector r measures the quality of fit of our model. But how do we turn this into a meaningful quantity? One method is to look at the coefficient of determination, which is more commonly refered to as the "R2 value. You can see the RP value of your fit in part (a) under the "Multiple R-squared" output in the linear model summary above. If y=[y1, 92, ... , Yn]" is our target vector with least-squares solution = Ag and residual vector is r=y-. Let . (91 + y2 + ... +yn) n 1 and be the average or mean of the entries of target vector y and let y* = (a, a, ..., a). (We call this vector y star", so ystar would be a fine name in R.) The RP value is lly -ll? R2 = 1 In|12 lly - y* lla lly - y*|l2 The R2 value is a number in (0,1). The squared-length ||y - y*|| is the total variance that is, how much the data varies from the mean, ||y4y|7 tells us the fraction of the total variance that is explained by our model. Thus, if R is near 1, then our model does a good job at *explaining the behavior of y via a linear combination of the columns of A. . To do: Find the RP value for our least squares solution to the cars data in part (a). Here are some helpful functions: + mean(vec) returns the mean (average) of the entries of the vector vec + repla, n) creates a constant vector of length n where every entry is 2. + Norm(vec) from the pracma package returns the magnitude (Euclidean length) of the vector vec. To learn more, you should take STAT 155: Introduction to Statistical Modeling. Below is a classic data set of fuel efficiency in 38 different automobiles. ## lbs HP Cyl MPG ## BuickEstatewagon 3967.60 155 8 16.9 ## FordCountrySquirewagon 3689.14 142 8 15.5 ## ChevyMalibuwagon 3288.55 125 8 19.2 ## ChryslerleBaronwagon 3585.49 150 8 18.5 ## Chevette 1961.05 68 4 30. ## ToyotaCorona 2329.60 95 4 27.5 ## Datsun 51e 2093.ee 97 4 27.2 ## DodgeOmni 2029.30 75 4 30.9 ## Audi5800 2575.30 103 5 20.3 ## Volvo 240GL 2857.40 125 6 17.0 ## Saab99GLE 2543.45 115 4 21.6 3103.10 133 6 16.2 ## Peugeot 694SL ## BuickCenturySpecial ## Mercury Zephyr 3075.80 105 6 20.6 2793.70 85 6 20.8 ## Dodge Aspen 3294.20 110 6 18.6 3103.10 120 6 18.1 ## AMC ConcordD/L ## ChevyCapriceclassic ## FordLTD 3494.40 130 8 17.0 3389.75 129 8 17.6 3599.05 138 8 16.5 3485.30 135 8 18.2 2352.35 88 4 26.5 2648.10 109 6 21.9 1797.25 65 4 34.1 1742.65 80 4 35.1 2429.70 80 4 27.4 ## Mercury Grand Marquis # DodgeStRegis ## Ford Mustang ## FordMustangGhia ## MazdaGLC ## DodgeColt ## AMCSpirit ## VWScirocco # Honda AccordLx ## BuickSkylark ## Chevycitation ## OldsOmega ## Pontiac Phoenix ## PlymouthHorizon ## Datsun 210 1819.90 71 4 31.5 1942.85 68 4 29.5 2429.70 90 4 28.4 2361.45 115 6 28.8 2457.00 115 6 26.8 2325.96 90 4 33.5 2002.ee 70 4 34.2 1838.20 65 4 31.8 ## Fiat Strada 1938. 30 69 4 37.3 ## VWDasher 1992.90 78 4 30.5 ## Datsun810 2561.65 97 6 22.0 ## BMW 320i 2366.00 110 4 21.5 ## VwRabbit 1925.00 71 4 31.9 a. Fit a linear model of the form mpg = 20 + a lbs + a2HP + azCyl. Find the coefficients 20, 21, 22, 23 and the length of the residual. If you have taken Stat 155, you can see that we are doing the exact same thing by comparing your results with ## ## Call: ## Im(formula = MPG - lbs + HP + Cyl) #TT ## Residuals: Min 1Q Median 30 Max ## -4.4669 -1.6011 -0.3246 1.0759 6.6231 ## ## Coefficients: Estimate Std. Error t value Pr(>It) #(Intercept) 49.644579 1.992433 24.917 2e-16 # lbs -0.008288 0.892316 -3.579 0.00186 # HP -0.973961 @.843862 -1.686 0.10091 ## Cyl 0.791590 0.730326 1.084 8.28684 # Signif. codes: @ "***@.001 0.01 0.05'. 2.1 1 ## Residual standard error: 2.791 on 34 degrees of freedom ## Multiple R-squared: 0.833, Adjusted R-squared: 0.8183 ## F-statistic: 56.55 on 3 and 34 DF, P-value: 2.656e-13 b. Add the cars weight in tons to your model and solve mpg=20 + a1(lbs) + a2(HP) + 23(Cyl) + a(tons). Compare the coefficients you get with those that you got in part a. Give a short explanation of what you see using some of the linear algebra language that we have learned in the course. c. The residual vector r measures the quality of fit of our model. But how do we turn this into a meaningful quantity? One method is to look at the coefficient of determination, which is more commonly refered to as the "R2 value. You can see the RP value of your fit in part (a) under the "Multiple R-squared" output in the linear model summary above. If y=[y1, 92, ... , Yn]" is our target vector with least-squares solution = Ag and residual vector is r=y-. Let . (91 + y2 + ... +yn) n 1 and be the average or mean of the entries of target vector y and let y* = (a, a, ..., a). (We call this vector y star", so ystar would be a fine name in R.) The RP value is lly -ll? R2 = 1 In|12 lly - y* lla lly - y*|l2 The R2 value is a number in (0,1). The squared-length ||y - y*|| is the total variance that is, how much the data varies from the mean, ||y4y|7 tells us the fraction of the total variance that is explained by our model. Thus, if R is near 1, then our model does a good job at *explaining the behavior of y via a linear combination of the columns of A. . To do: Find the RP value for our least squares solution to the cars data in part (a). Here are some helpful functions: + mean(vec) returns the mean (average) of the entries of the vector vec + repla, n) creates a constant vector of length n where every entry is 2. + Norm(vec) from the pracma package returns the magnitude (Euclidean length) of the vector vec. To learn more, you should take STAT 155: Introduction to Statistical ModelingStep by Step Solution
There are 3 Steps involved in it
Step: 1

Get Instant Access to Expert-Tailored Solutions
See step-by-step solutions with expert insights and AI powered tools for academic success
Step: 2

Step: 3

Ace Your Homework with AI
Get the answers you need in no time with our AI-driven, step-by-step assistance
Get Started


