Answered step by step
Verified Expert Solution
Question
1 Approved Answer
PLEASE ANSWER ALL PARTS!!!!! Forecasting Problems This is a two-part assignment (all due at the start of class on their respective days): Pricing Problems I


PLEASE ANSWER ALL PARTS!!!!!
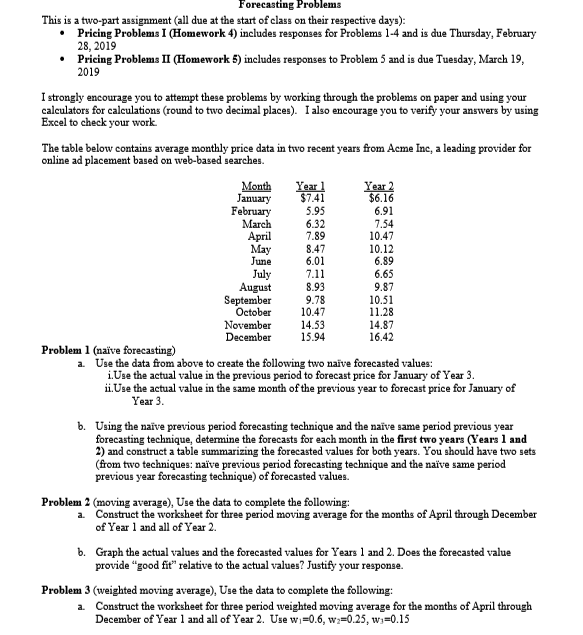
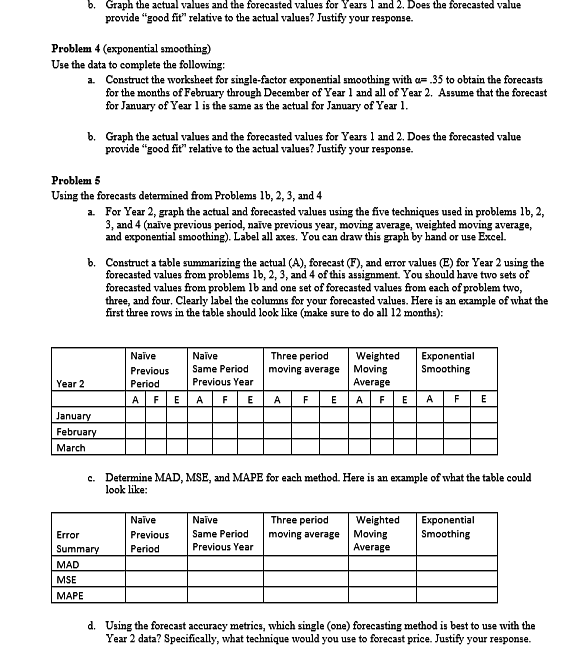
Forecasting Problems This is a two-part assignment (all due at the start of class on their respective days): Pricing Problems I (Homework 4) includes responses for Problems 1-4 and is due Thursday, February 28, 2019 Pricing ProblemsII (Homework 5) includes responses to Problem 5 and is due Tuesday, March 19 2019 I strongly encourage you to attempt these problems by working through the problems on paper and using your calculators forlations (round to two decimal places). Ialso encourage you to verify your answers by using Excel to check your work. The table below contains average monthly price data in two recent years from Acme Inc, a leading provider for online ad placement based on web-based searches. MonthYear 1 anuary$7.41 5.95 6.32 7.89 May 8.47 $6.16 February March 7.54 10.47 10.12 6.89 July 7.11 8.93 9.78 August September October November December 9.87 10.51 11.28 14.87 16.42 14.53 Problem 1 (naive forecasting) a. Use the data from above to create the following two naive forecasted values: i.Use the actual value in the previous period to forecast price for January of Year 3 ii.Use the actual value in the same month of the previous year to forecast price for January of ear b. Using the naive previous period forecasting technique and the naive same period previous year forecasting technique, determine the forecasts for each month in the first two years (Years 1 and 2 and construct a table summarizing the forecasted values for both years. You should have two sets (from two techniques: naive previous period forecasting technique and the naive same period previous year forecasting technique) of forecasted values. Problem 2 (moving average) Use the data to complete the following: a. Construct the worksheet for three period moving average for the months of April through December of Year 1 and all of Year 2. b. Graph the actual values and the forecasted values for Years1 and 2. Does the forecasted value provide "good fit relative to the actual values? Justify your response. Problem 3 (weighted moving average), Use the data to complete the following: Construct the worksheet for three period weighted moving average for the months of April through December of Yea 1 and all of Year 2. Use wi-0.6, W 0.25, w 0.15 a. b. Graph the actual values and the forecasted values for Years 1 and 2. Does the forecasted value provide "good fit" relative to the actual values? Justify your response. Problem 4 (exponential smoothing) Use the data to complete the following: a. Construct the worksheet for single-factor exponential smoothing with a- .35 to obtain the forecasts for the months of February through December of Year 1 and all of Year2. for January of Year 1 is the same as the actual for January of Year 1. Assume that the forecast b. Graph the actual values and the forecasted values for Years 1 and 2. Does the forecasted value provide "good fit" relative to the actual values? Justify your response. Problem 5 Using the forecasts determined from Problems lb, 2, 3, and 4 a. For Year 2, graph the actual and forecasted values using the five techniques used in problems lb, 2, 3, and 4 (nave previous period, naive previous year, moving average, weighted moving average, and exponential smoothing). Label all axes. You can draw this graph by hand or use Excel. b. Construct a table summarizing the actual (A), forecast (F), and error values (E) for Year 2 using the forecasted values from problems lb, 2, 3, and 4 of this assignment. You should have two sets of forecasted values from problem lb and one set of forecasted values from each of problem two three, and four. Clearly label the columns for your forecasted values. Here is an example of what the first three rows in the table should look like (make sure to do all 12 months) Naive Naive Previous Same Period moving average Moving Period Three period Weighted Exponential Smoothing Year 2 Previous Year Average anua Februa March Determine MAD, MSE, and MAPE for each method. Here is an example of what the table could look like: c. Naive Naive Three periodWeighted Exponential Smoothing Previous Same Period moving average Moving Period Error Summa MAD MSE MAPE Previous Year Average d. Using the forecast accuracy metrics, which single (one) forecasting method is best to use with the Year 2 data? Specifically, what technique would you use to forecast price. Justify your responseStep by Step Solution
There are 3 Steps involved in it
Step: 1

Get Instant Access to Expert-Tailored Solutions
See step-by-step solutions with expert insights and AI powered tools for academic success
Step: 2

Step: 3

Ace Your Homework with AI
Get the answers you need in no time with our AI-driven, step-by-step assistance
Get Started


