please answer all parts of the question in bold

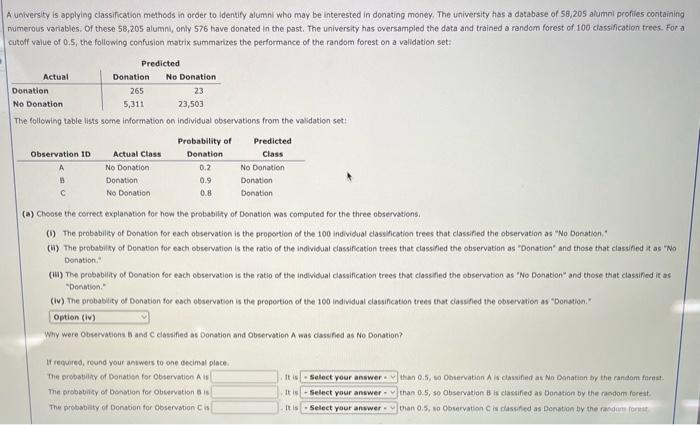
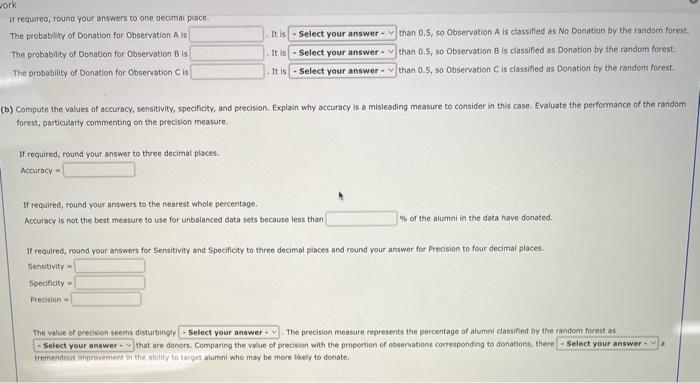
A university is applying classification methods in order to ldentify alumni who may be interested in donating money. The university has a database of 58 , 205 alumni profies conitaining numerous variablos: Of these 58,205 alumnl, only 576 have donated in the past. The university has oversampled the data and trained a random forest of 100 classification trees. For a cutolf value of 0.5 , the following confusion matrix summarizes the performance of the random forest on a validation set: The following table lists some information on individual observations from the validation set: (a) Choose the correct explanation for how the probability of Donation was computed for the three observations. (i) The probsbiiky of Donation for each observation is the proportion of the 100 individual classification trees that classified the observation as "No Donation." (6) The probability of Donation for each observation is the ratio of the individual ciassification thees that classifed the observation as "Donstion" and those that classified it as "No Donation." (ii) The probability of Donation foc each observation is the ratio of the individual classification trees that classified the observabion as "No Donation" and those that classified it as "Donatien." (iv) The orobablity of Donation for each observation is the propertion of the 100 individual classification trees that ciasmed the obrervation as "Donation." Why were Observations 5 and C classifed as Donstion and observation A was classfied as No Donation? If required, reund your antwers to one cecimal place. The erobatiity of Donatish for observation A is it is than 0.5 , wo observation A is clasifed at No Gonation by the randomt furts. The probbbiaty of bonotion for Oblervation B is than 0.5 , so Observation B is classifies as bontion by the random foreit It requrec, roung your answers wo one qeomal pace. The probabkity of Donation for Observation A is It is than 0.5, so Observation A is classified as No Donation by the random forest. The probabiity of Donation for Observation B is than 0,5 , so Observation B is chassified as Donation by the random forest. The probability of Denation for Observation C is than 0.5 , so observation C is classified as Donation by the randori forest. b) Compote the values of accuracy, sensitivity, specificity, and precision. Explain why aceuracy is a misleading measure to consider in this case. Evaluate the performance of the randorn forest, particularly commenting on the precision measure. If required, round your answer to three decmal places. Accuracy = If required, round your answers to the nearest whole percentage. Accuracy is not the best measure to use for unbalanced data sets because less than \% of the alumni in the data have donated. If required, round your answers for Sensitivity and Specificity to three decimal places and round your answer for precision to four decimal places. Sensitivity = Specificity = Precition = The velue of orecivon seems disturbingiy The precision meosure represents the percentage of alumal classified by the random forest as that are donors. Comparing the volue of precision with the proportion of observations comresponding to donations, there tremendeot inprovemeent vi the inbility to target alumai who may be more likely to dooate


