

Answered step by step
Verified Expert Solution
Question
1 Approved Answer
Please answer all parts. Thank you Homework: Chapter 08 Homework Save Score: 0 of 1 pt 4 of 10 (2 complete) HW Score: 20%, 2
Please answer all parts. Thank you
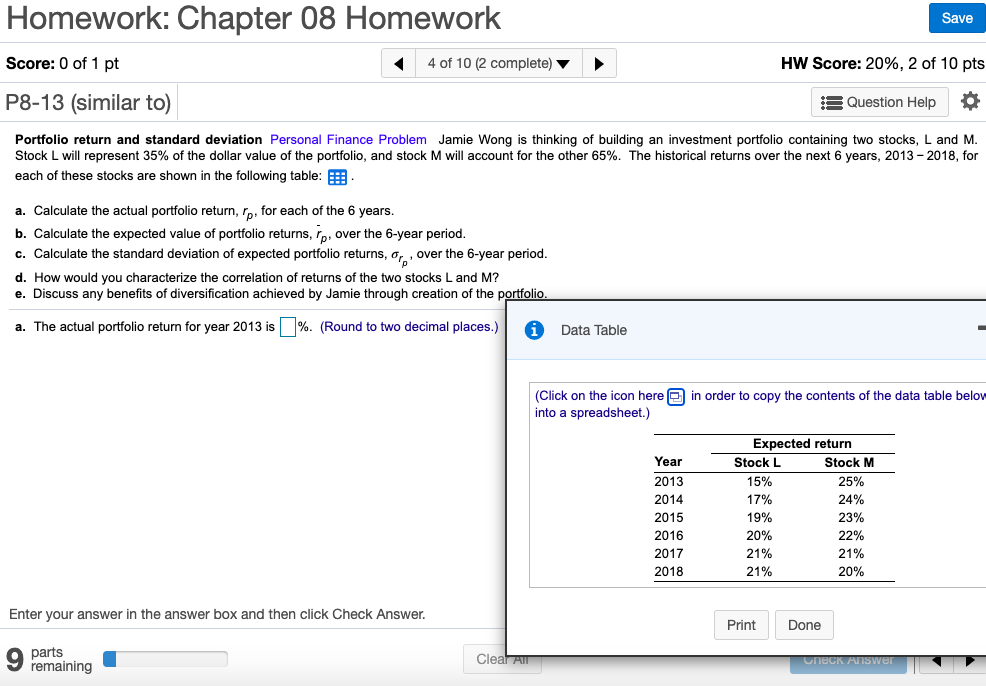
Homework: Chapter 08 Homework Save Score: 0 of 1 pt 4 of 10 (2 complete) HW Score: 20%, 2 of 10 pts P8-13 (similar to) A Question Help Portfolio return and standard deviation Personal Finance Problem Jamie Wong is thinking of building an investment portfolio containing two stocks, L and M. Stock L will represent 35% of the dollar value of the portfolio, and stock M will account for the other 65%. The historical returns over the next 6 years, 2013 - 2018, for each of these stocks are shown in the following table: a. Calculate the actual portfolio return, rp, for each of the 6 years. b. Calculate the expected value of portfolio returns, rp, over the 6-year period. C. Calculate the standard deviation of expected portfolio returns, ore, over the 6-year period. d. How would you characterize the correlation of returns of the two stocks L and M? e. Discuss any benefits of diversification achieved by Jamie through creation of the portfolio. a. The actual portfolio return for year 2013 is %. (Round to two decimal places.) Data Table (Click on the icon here in order to copy the contents of the data table below into a spreadsheet.) Year 2013 2014 2015 2016 2017 2018 Expected return Stock L Stock M 15% 25% 17% 24% 19% 23% 20% 22% 21% 21% 21% 20% Enter your answer in the answer box and then click Check Answer. Print Done parts Clear All remaining neck Answer Homework: Chapter 08 Homework Save Score: 0 of 1 pt 4 of 10 (2 complete) HW Score: 20%, 2 of 10 pts P8-13 (similar to) A Question Help Portfolio return and standard deviation Personal Finance Problem Jamie Wong is thinking of building an investment portfolio containing two stocks, L and M. Stock L will represent 35% of the dollar value of the portfolio, and stock M will account for the other 65%. The historical returns over the next 6 years, 2013 - 2018, for each of these stocks are shown in the following table: a. Calculate the actual portfolio return, rp, for each of the 6 years. b. Calculate the expected value of portfolio returns, rp, over the 6-year period. C. Calculate the standard deviation of expected portfolio returns, ore, over the 6-year period. d. How would you characterize the correlation of returns of the two stocks L and M? e. Discuss any benefits of diversification achieved by Jamie through creation of the portfolio. a. The actual portfolio return for year 2013 is %. (Round to two decimal places.) Data Table (Click on the icon here in order to copy the contents of the data table below into a spreadsheet.) Year 2013 2014 2015 2016 2017 2018 Expected return Stock L Stock M 15% 25% 17% 24% 19% 23% 20% 22% 21% 21% 21% 20% Enter your answer in the answer box and then click Check Answer. Print Done parts Clear All remaining neckStep by Step Solution
There are 3 Steps involved in it
Step: 1

Get Instant Access to Expert-Tailored Solutions
See step-by-step solutions with expert insights and AI powered tools for academic success
Step: 2

Step: 3
Ace Your Homework with AI
Get the answers you need in no time with our AI-driven, step-by-step assistance
Get Started
Financial Management An Introduction
Authors: Jim McMenamin
1st Edition
0415181623, 9780415181624