please answer all


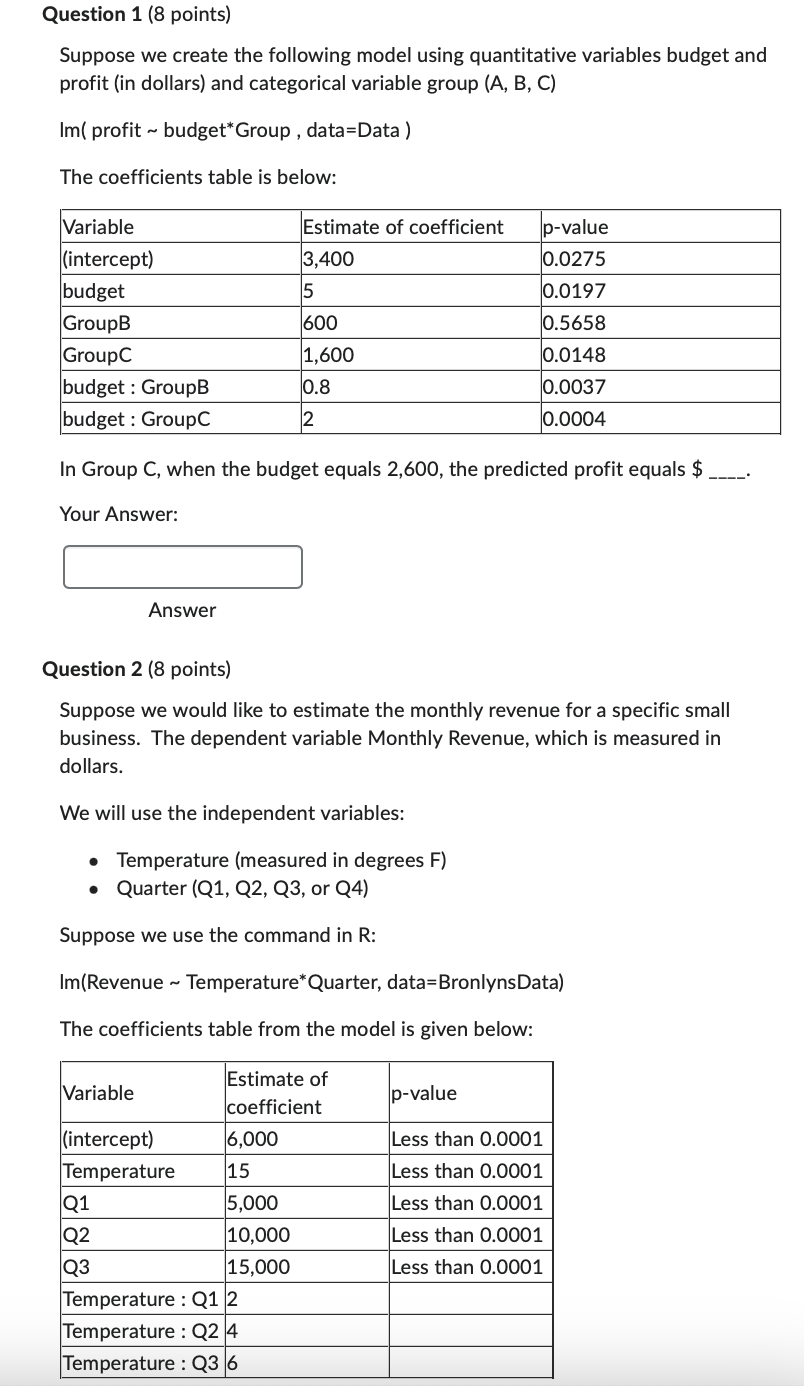
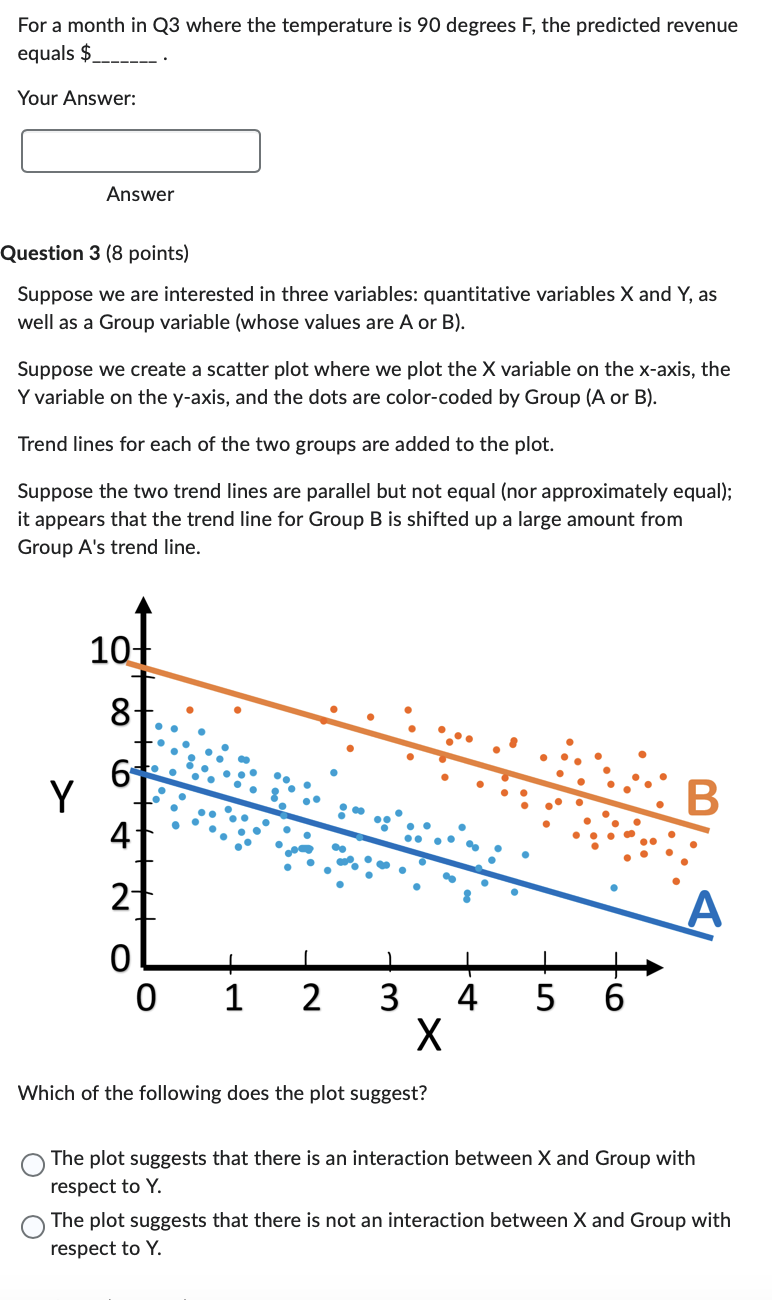
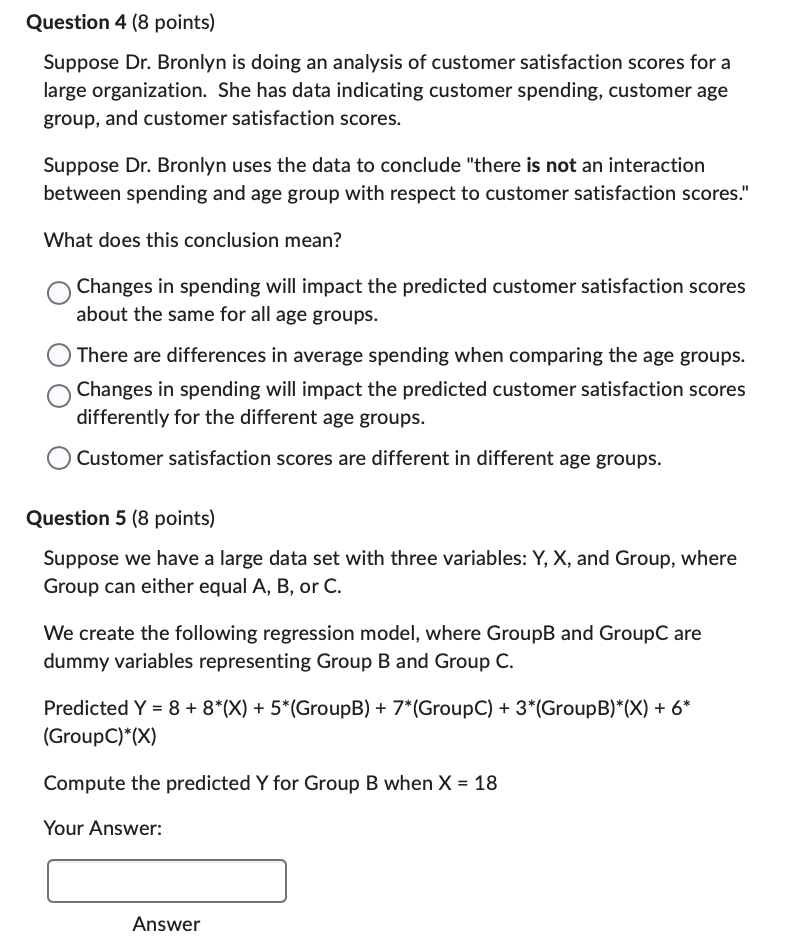
Question 1 (8 points) Suppose we create the following model using quantitative variables budget and profit (in dollars) and categorical variable group (A, B, C) Im ( profit budget Group , data=Data ) The coefficients table is below: In Group C, when the budget equals 2,600, the predicted profit equals $ Your Answer: Answer Question 2 (8 points) Suppose we would like to estimate the monthly revenue for a specific small business. The dependent variable Monthly Revenue, which is measured in dollars. We will use the independent variables: - Temperature (measured in degrees F) - Quarter (Q1, Q2, Q3, or Q4) Suppose we use the command in R: Im (Revenue Temperature*Quarter, data=BronlynsData) The coefficients table from the model is given below: For a month in Q3 where the temperature is 90 degrees F, the predicted revenue equals : Your Answer: Answer Question 3 (8 points) Suppose we are interested in three variables: quantitative variables X and Y, as well as a Group variable (whose values are A or B). Suppose we create a scatter plot where we plot the X variable on the x-axis, the Y variable on the y-axis, and the dots are color-coded by Group (A or B). Trend lines for each of the two groups are added to the plot. Suppose the two trend lines are parallel but not equal (nor approximately equal); it appears that the trend line for Group B is shifted up a large amount from Group A's trend line. Which of the following does the plot suggest? The plot suggests that there is an interaction between X and Group with respect to Y. The plot suggests that there is not an interaction between X and Group with respect to Y. Suppose Dr. Bronlyn is doing an analysis of customer satisfaction scores for a large organization. She has data indicating customer spending, customer age group, and customer satisfaction scores. Suppose Dr. Bronlyn uses the data to conclude "there is not an interaction between spending and age group with respect to customer satisfaction scores." What does this conclusion mean? Changes in spending will impact the predicted customer satisfaction scores about the same for all age groups. There are differences in average spending when comparing the age groups. Changes in spending will impact the predicted customer satisfaction scores differently for the different age groups. Customer satisfaction scores are different in different age groups. Question 5 (8 points) Suppose we have a large data set with three variables: Y,X, and Group, where Group can either equal A, B, or C. We create the following regression model, where GroupB and GroupC are dummy variables representing Group B and Group C. Predicted Y=8+8(X)+5( GroupB )+7( GroupC )+3(GroupB)(X)+6 (GroupC)* (X) Compute the predicted Y for Group B when X=18 Your Answer: Answer Question 1 (8 points) Suppose we create the following model using quantitative variables budget and profit (in dollars) and categorical variable group (A, B, C) Im ( profit budget Group , data=Data ) The coefficients table is below: In Group C, when the budget equals 2,600, the predicted profit equals $ Your Answer: Answer Question 2 (8 points) Suppose we would like to estimate the monthly revenue for a specific small business. The dependent variable Monthly Revenue, which is measured in dollars. We will use the independent variables: - Temperature (measured in degrees F) - Quarter (Q1, Q2, Q3, or Q4) Suppose we use the command in R: Im (Revenue Temperature*Quarter, data=BronlynsData) The coefficients table from the model is given below: For a month in Q3 where the temperature is 90 degrees F, the predicted revenue equals : Your Answer: Answer Question 3 (8 points) Suppose we are interested in three variables: quantitative variables X and Y, as well as a Group variable (whose values are A or B). Suppose we create a scatter plot where we plot the X variable on the x-axis, the Y variable on the y-axis, and the dots are color-coded by Group (A or B). Trend lines for each of the two groups are added to the plot. Suppose the two trend lines are parallel but not equal (nor approximately equal); it appears that the trend line for Group B is shifted up a large amount from Group A's trend line. Which of the following does the plot suggest? The plot suggests that there is an interaction between X and Group with respect to Y. The plot suggests that there is not an interaction between X and Group with respect to Y. Suppose Dr. Bronlyn is doing an analysis of customer satisfaction scores for a large organization. She has data indicating customer spending, customer age group, and customer satisfaction scores. Suppose Dr. Bronlyn uses the data to conclude "there is not an interaction between spending and age group with respect to customer satisfaction scores." What does this conclusion mean? Changes in spending will impact the predicted customer satisfaction scores about the same for all age groups. There are differences in average spending when comparing the age groups. Changes in spending will impact the predicted customer satisfaction scores differently for the different age groups. Customer satisfaction scores are different in different age groups. Question 5 (8 points) Suppose we have a large data set with three variables: Y,X, and Group, where Group can either equal A, B, or C. We create the following regression model, where GroupB and GroupC are dummy variables representing Group B and Group C. Predicted Y=8+8(X)+5( GroupB )+7( GroupC )+3(GroupB)(X)+6 (GroupC)* (X) Compute the predicted Y for Group B when X=18 Your


