please answer all question.
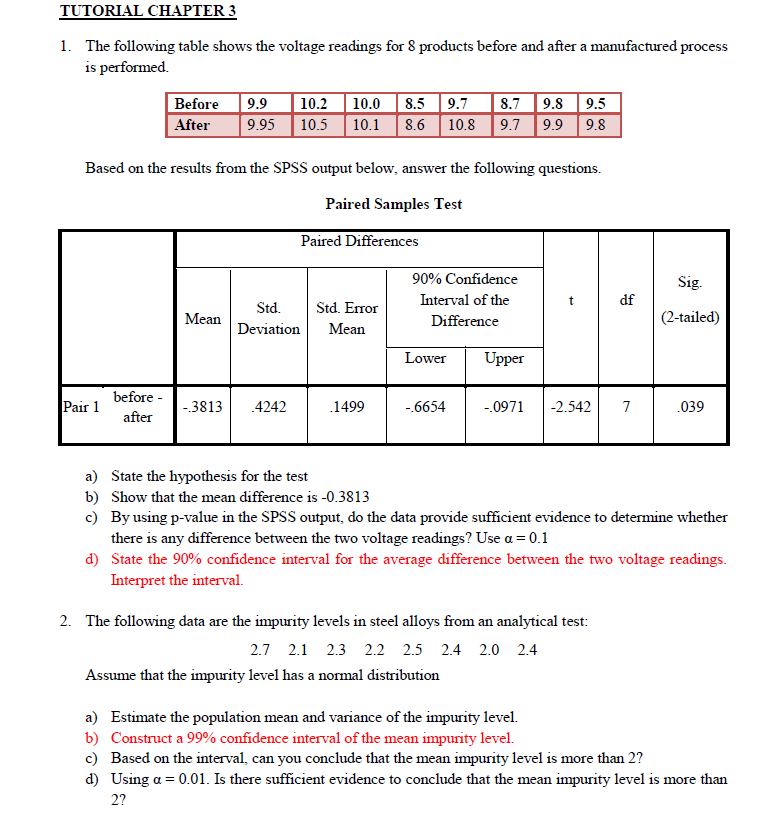
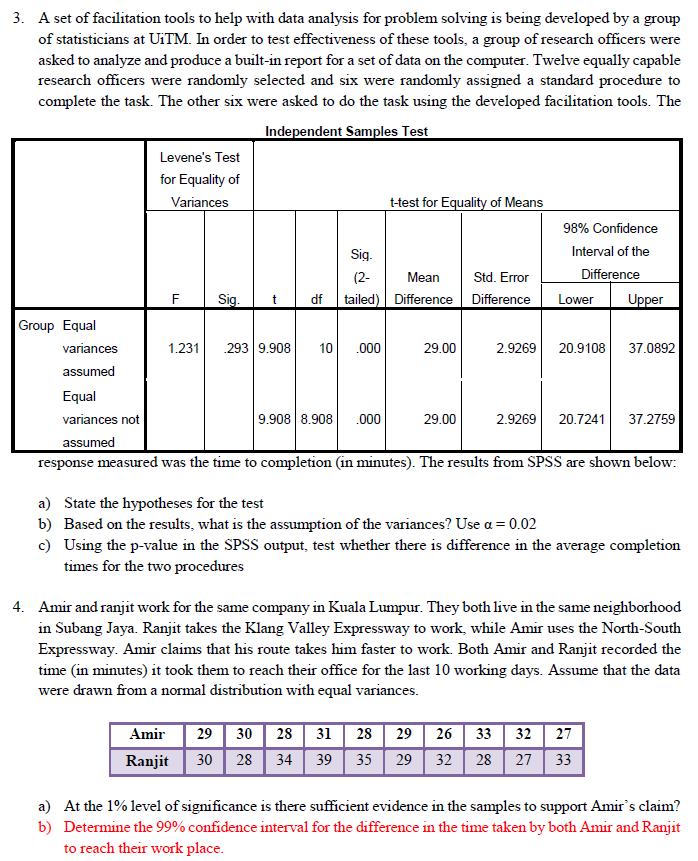
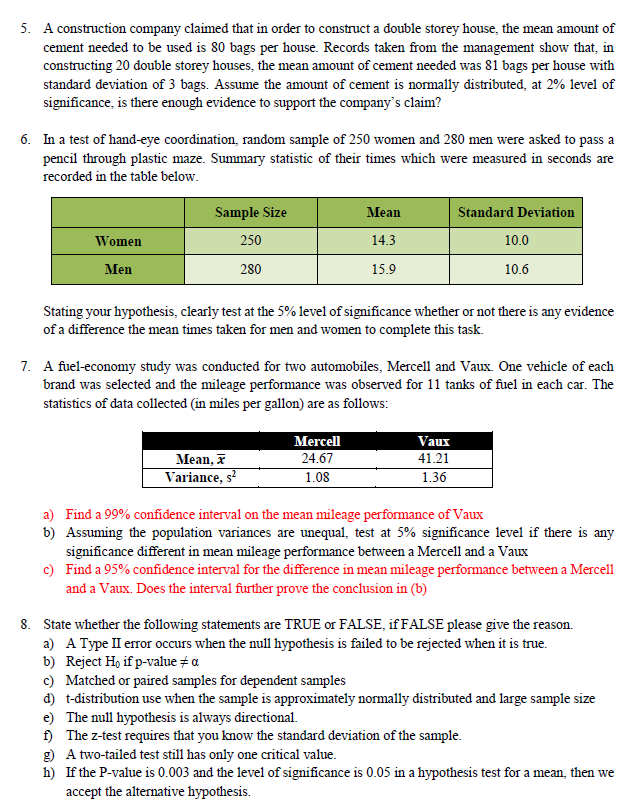
TUTORIAL CHAPTER 3 1. The following table shows the voltage readings for 8 products before and after a manufactured process is performed Before 9.9 10.2 10.0 8.5 9.7 8.7 9.8 9.5 After 9.95 10.5 10.1 8.6 10.8 9.7 9.9 9.8 Based on the results from the SPSS output below, answer the following questions. Paired Samples Test Paired Differences 90% Confidence Sig Std. Std. Error Interval of the df Mean Mean Difference (2-tailed) Deviation Lower Upper Pair 1 before - -.3813 .4242 .1499 -.6654 -.0971 -2.542 7 039 after State the hypothesis for the test b) Show that the mean difference is -0.3813 c) By using p-value in the SPSS output, do the data provide sufficient evidence to determine whether there is any difference between the two voltage readings? Use a = 0.1 d) State the 90% confidence interval for the average difference between the two voltage readings. Interpret the interval. 2. The following data are the impurity levels in steel alloys from an analytical test: 2.7 2.1 2.3 2.2 2.5 2.4 2.0 2.4 Assume that the impurity level has a normal distribution a) Estimate the population mean and variance of the impurity level. b ) Construct a 99% confidence interval of the mean impurity level. c) Based on the interval, can you conclude that the mean impurity level is more than 2? d) Using a = 0.01. Is there sufficient evidence to conclude that the mean impurity level is more than 2?3. A set of facilitation tools to help with data analysis for problem solving is being developed by a group of statisticians at UITM. In order to test effectiveness of these tools, a group of research officers were asked to analyze and produce a built-in report for a set of data on the computer. Twelve equally capable research officers were randomly selected and six were randomly assigned a standard procedure to complete the task. The other six were asked to do the task using the developed facilitation tools. The Independent Samples Test Levene's Test for Equality of Variances t-test for Equality of Means 98% Confidence Sig Interval of the (2- Mean Std. Error Difference F Sig df tailed) Difference Difference Lower Upper Group Equal vanances 1.231 .293 9.908 10 .000 29.00 2.9269 20.9108 37.0892 assumed Equal variances not 9.908 8.908 000 29.00 2.9269 20.7241 37.2759 assumed response measured was the time to completion (in minutes). The results from SPSS are shown below: State the hypotheses for the test b) Based on the results, what is the assumption of the variances? Use a = 0.02 c) Using the p-value in the SPSS output, test whether there is difference in the average completion times for the two procedures 4. Amir and ranjit work for the same company in Kuala Lumpur. They both live in the same neighborhood in Subang Jaya. Ranjit takes the Klang Valley Expressway to work, while Amir uses the North-South Expressway. Amir claims that his route takes him faster to work. Both Amir and Ranjit recorded the time (in minutes) it took them to reach their office for the last 10 working days. Assume that the data were drawn from a normal distribution with equal variances. Amir 29 30 28 31 28 29 26 33 32 27 Ranjit 30 28 34 39 35 29 32 28 27 33 ) At the 1% level of significance is there sufficient evidence in the samples to support Amir's claim? b) Determine the 99% confidence interval for the difference in the time taken by both Amir and Ranjit to reach their work place.\f


