please answer all questions
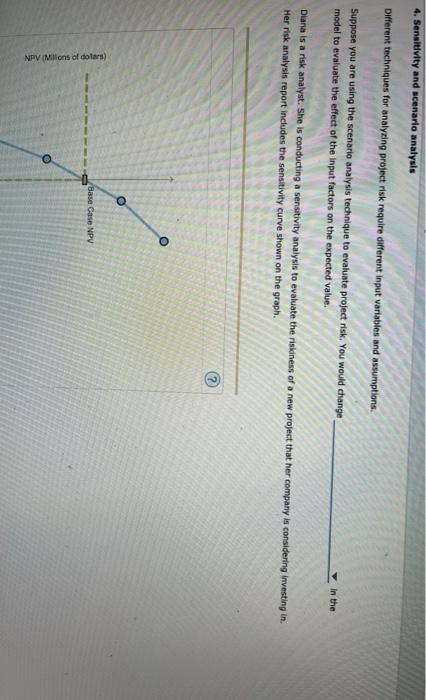
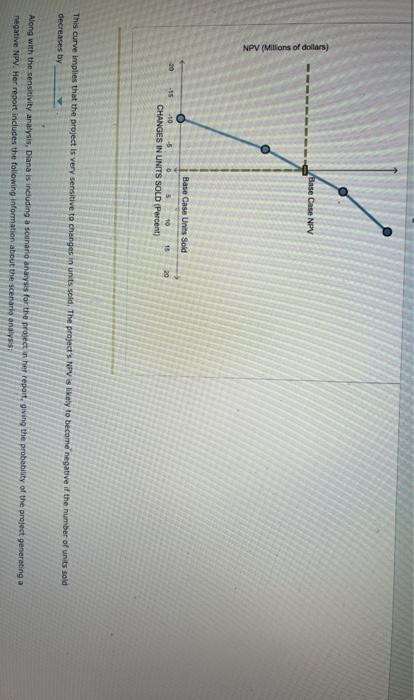
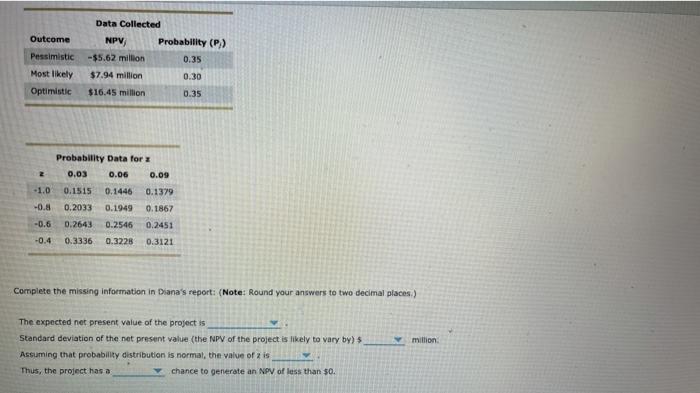
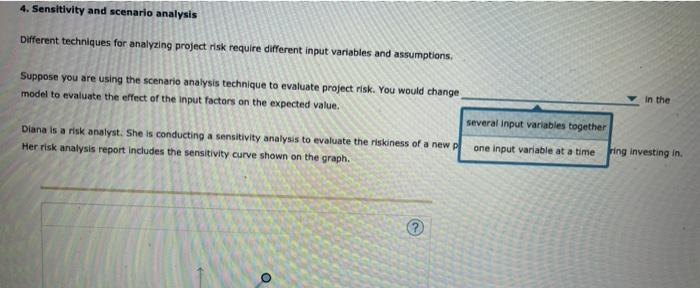
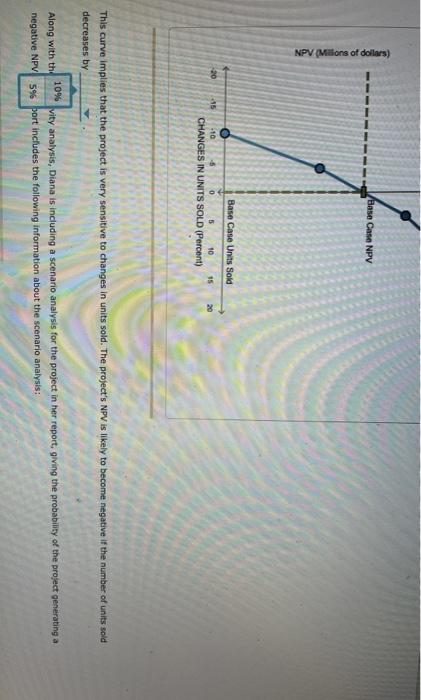
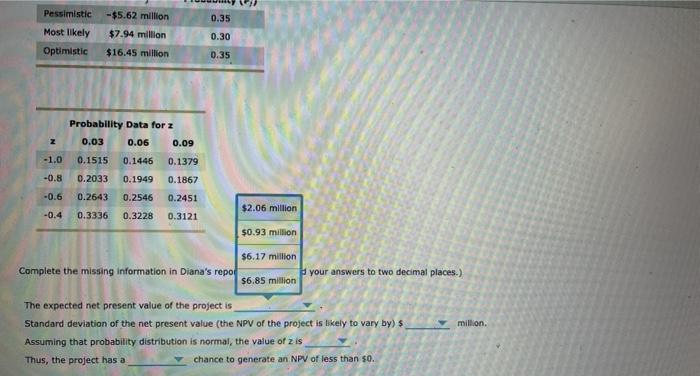
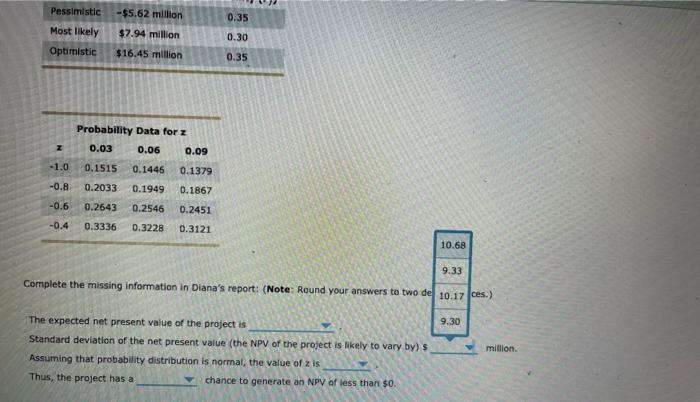
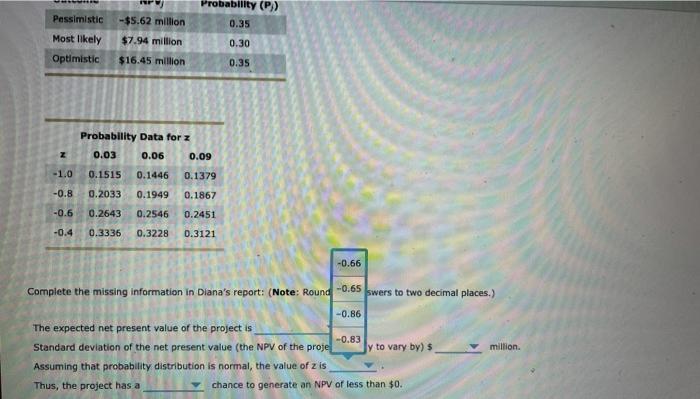
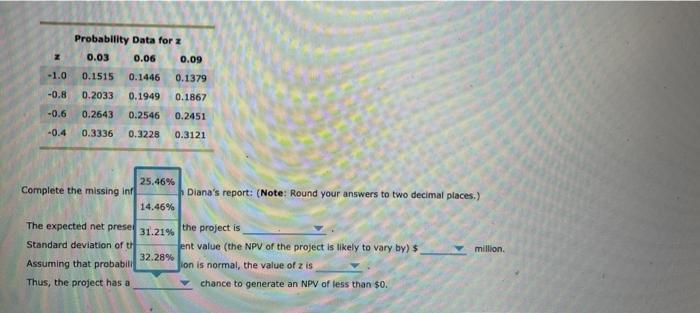
4. Sensitivity and scenario analysis Different techniques for analyzing project risk require different input variables and assumptions, Suppose you are using the scenario analysis technique to evalunte project risk. You would change model to evaluate the effect of the input factors on the expected value. In the Diana is a risk analyst. She is conducting a sensitivity analysis to evaluate the riskiness of a new project that her company is considering investing in. Her risk analysis report Includes the sensitivity curve shown on the graph. Base Case NPV - 1 NPV (Milions of dollars) Base Case NPV NPV (Milions of dollars) Base Case Unis Sold 20 13 -10 CHANGES IN UNITS SOLD (Percent) 20 This curve implies that the project is very sensitive to changes in units sold. The project's NPV is likely to become negative if the number of units sold decreases by Along with the sensitivity analysis, Diana is including a scenario analysis for the project her report, giving the probability of the project generating a negative NPV. Her report includes the following information about the scenario analys: Outcome Pessimistic Most likely Optimistic Data Collected NPVA Probability (P) -$5.62 million 0.35 $7.94 million 0.30 $16.45 million 0.35 Probability Data for 0.03 0.06 0.09 -1.0 0.1515 0.1446 0.1379 -0.8 0.2033 0.1949 0.1867 -0.6 0.2643 0.2546 0.2451 -0.4 0.3336 0.3228 0.3121 Complete the missing information in Diana's report: (Note: Round your answers to two decimal places) million The expected net present value of the project is Standard deviation of the net present value (the NPV of the project is likely to vary by) Assuming that probability distribution is normal, the value of 2 is Thus, the project has a chance to generate an NPV of less than 50. 4. Sensitivity and scenario analysis Different techniques for analyzing project risk require different input variables and assumptions, Suppose you are using the scenario analysis technique to evaluate project risk. You would change model to evaluate the effect of the input factors on the expected value. in the several input variables together Diana is a risk analyst. She is conducting a sensitivity analysis to evaluate the riskiness of a new Her risk analysis report includes the sensitivity curve shown on the graph. one input variable at a time ring Investing in O - - Base Case NPV NPV (Millions of dollars) Base Case Units Sold 20 15 20 -10 0 5 10 CHANGES IN UNITS SOLD (Percent) This curve implies that the project is very sensitive to changes in units sold. The project's NPV is likely to become negative if the number of units sold decreases by 10% Along with the vity analysis, Diana is including a scenario analysis for the project in her report, giving the probability of the project generating a negative NPV 5% bort includes the following information about the scenario analysis: -$5.62 million 0.35 Pessimistic Most likely Optimistic $7.94 million $16.45 million 0.30 0.35 Probability Data for 2 0.03 0.06 0.09 -1.0 0.1515 0.1446 0.1379 -0.8 0.2033 0.1949 0.1867 -0.6 0.2643 0.2546 0.2451 0.3121 $2.06 million -0.4 0.3336 0.3228 $0.93 million $6.17 million Complete the missing information in Diana's repo your answers to two decimal places.) 56.85 million million, The expected net present value of the project is Standard deviation of the net present value (the NPV of the project is likely to vary by) $ Assuming that probability distribution is normal, the value of z is Thus, the project has a chance to generate an NPV of less than so. -$5.62 million 0.35 Pessimistic Most likely Optimistic $7.94 million 0.30 $16.45 million 0.35 Z Probability Data for z 0.03 0.06 0.09 0.1515 0.1446 0.1379 0.2033 0.1949 0.1867 -1.0 -0.8 -0.6 0.2643 0.2546 0.2451 -0.4 0.3336 0.3228 0.3121 10.68 9.33 Complete the missing information in Diana's report: (Note: Round your answers to two de 10.17 ces) 9.30 The expected net present value of the project is Standard deviation of the net present value (the NPV of the project is likely to vary by) $ Assuming that probability distribution is normal, the value of 2 is Thus, the project has a chance to generate an NPV of less than $0. million. -$5.62 million Pessimistic Most likely Optimistic Probability (P)) 0.35 0.30 $7.94 million $16.45 million 0.35 Z Probability Data for z 0.03 0.06 0.09 0.1515 0.1446 0.1379 0.2033 0.1949 0.1867 -1.0 -0.8 -0.6 0.2643 0.2546 0.2451 -0.4 0.3336 0.3228 0.3121 -0.66 Complete the missing information in Diana's report: (Note: Round -0.65 swers to two decimal places.) -0.86 The expected net present value of the project is -0.83 Standard deviation of the net present value (the NPV of the proje Jy to vary by) $ million. Assuming that probability distribution is normal, the value of z is Thus, the project has a chance to generate an NPV of less than $0. Z Probability Data for z 0.03 0.06 0.09 0.1515 0.1446 0.1379 0.2033 0.1949 0.1867 -1.0 -0.8 -0.6 0.2643 0.2546 0.2451 -0.4 0.3336 0.3228 0.3121 25.46% Complete the missing in Diana's report: (Note: Round your answers to two decimal places.) 14.46% The expected net presed the project is 31.21% Standard deviation of th ent value (the NPV of the project is likely to vary by) $ million. 32.28% Assuming that probabili Jion is normal, the value of z is Thus, the project has a chance to generate an NPV of less than $0