 Please answer all requirements and blanks in (blue). Please display formulas used to show work and show the correct values. Please show work on how chart was created or list steps and show chart needed in the blue space.
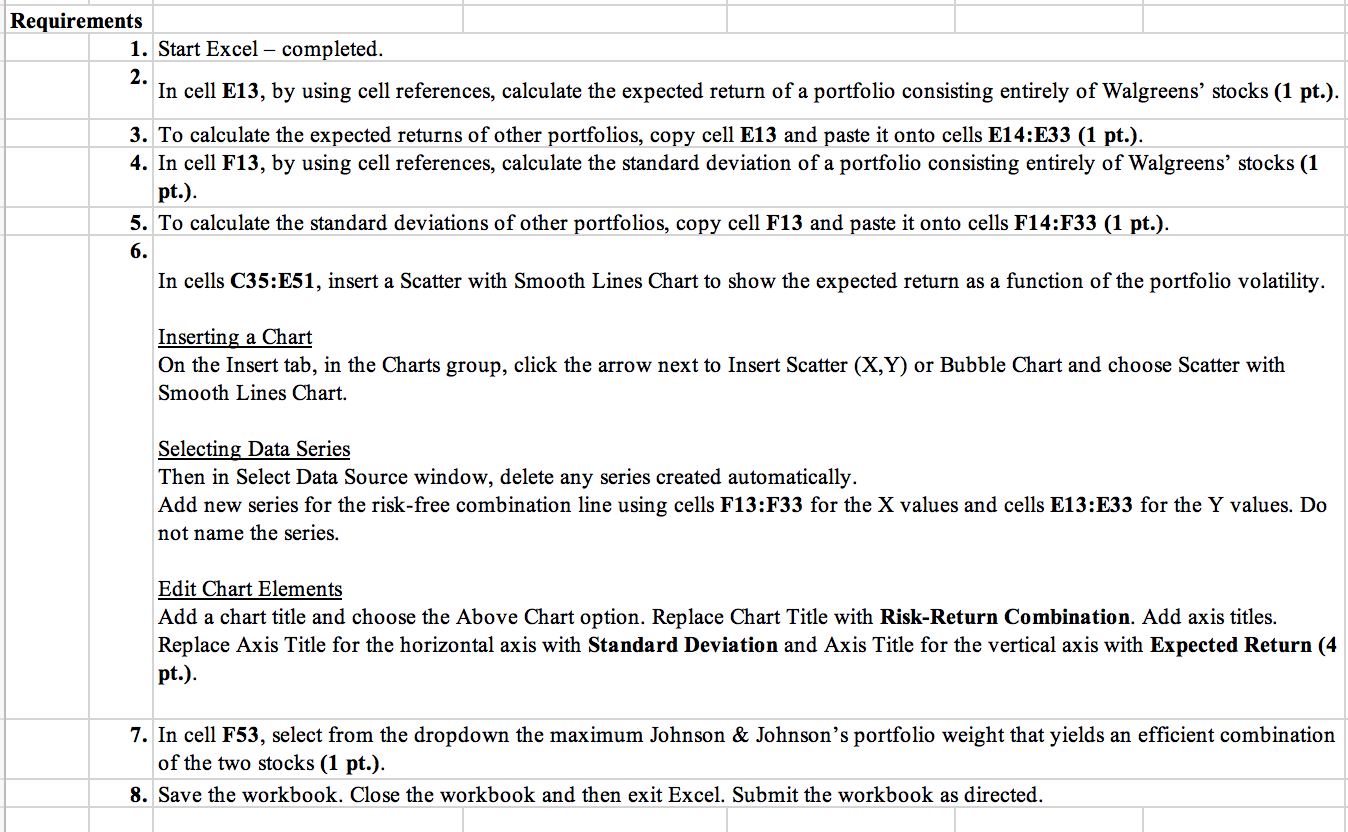
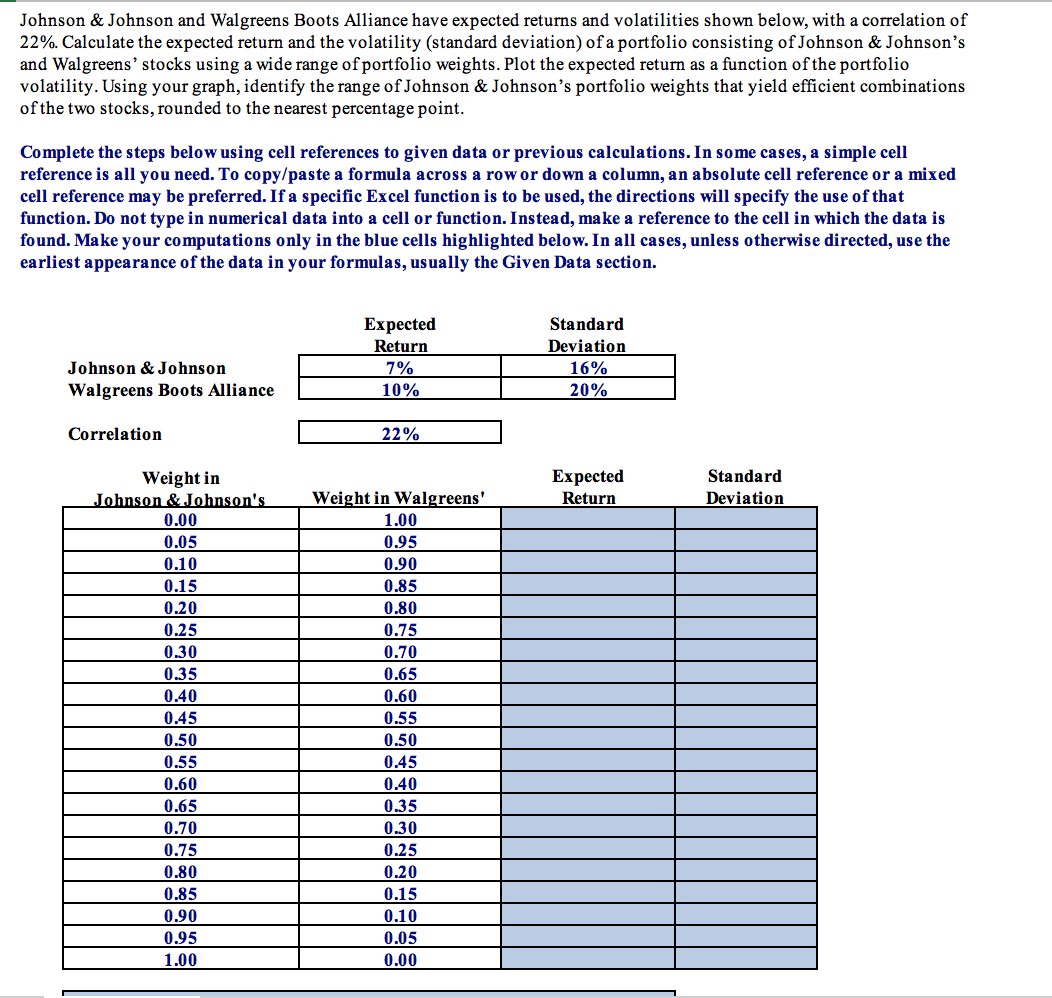
Requirements 1. Start Excel - completed. 2. In cell E13, by using cell references, calculate the expected return of a portfolio consisting entirely of Walgreens' stocks (1 pt.). 3. To calculate the expected returns of other portfolios, copy cell E13 and paste it onto cells E14:E33 (1 pt.). 4. In cell F13, by using cell references, calculate the standard deviation of a portfolio consisting entirely of Walgreens' stocks (1 pt.). 5. To calculate the standard deviations of other portfolios, copy cell F13 and paste it onto cells F14:F33 (1 pt.). 6. In cells C35:E51, insert a Scatter with Smooth Lines Chart to show the expected return as a function of the portfolio volatility. Inserting a Chart On the Insert tab, in the Charts group, click the arrow next to Insert Scatter (X,Y) or Bubble Chart and choose Scatter with Smooth Lines Chart. Selecting Data Series Then in Select Data Source window, delete any series created automatically. Add new series for the risk-free combination line using cells F13:F33 for the X values and cells E13:E33 for the Y values. Do not name the series. Edit Chart Elements Add a chart title and choose the Above Chart option. Replace Chart Title with Risk-Return Combination. Add axis titles. Replace Axis Title for the horizontal axis with Standard Deviation and Axis Title for the vertical axis with Expected Return (4 pt.). 7. In cell F53, select from the dropdown the maximum Johnson & Johnson's portfolio weight that yields an efficient combination of the two stocks (1 pt.). 8. Save the workbook. Close the workbook and then exit Excel. Submit the workbook as directed. Johnson & Johnson and Walgreens Boots Alliance have expected returns and volatilities shown below, with a correlation of 22%. Calculate the expected return and the volatility (standard deviation of a portfolio consisting of Johnson & Johnson's and Walgreens' stocks using a wide range of portfolio weights. Plot the expected return as a function of the portfolio volatility. Using your graph, identify the range of Johnson & Johnson's portfolio weights that yield efficient combinations of the two stocks, rounded to the nearest percentage point. Complete the steps below using cell references to given data or previous calculations. In some cases, a simple cell reference is all you need. To copy/paste a formula across a row or down a column, an absolute cell reference or a mixed cell reference may be preferred. If a specific Excel function is to be used, the directions will specify the use of that function. Do not type in numerical data into a cell or function. Instead, make a reference to the cell in which the data is found. Make your computations only in the blue cells highlighted below. In all cases, unless otherwise directed, use the earliest appearance of the data in your formulas, usually the Given Data section. Expected Return 7% 10% Standard Deviation 16% 20% Johnson & Johnson Walgreens Boots Alliance Correlation 22% Expected Return Standard Deviation Weight in Johnson & Johnson's 0.00 0.05 0.10 0.15 0.20 0.25 0.30 0.35 0.40 0.45 0.50 0.55 0.60 0.65 0.70 0.75 0.80 0.85 0.90 0.95 1.00 Weight in Walgreens' 1.00 0.95 0.90 0.85 0.80 0.75 0.70 0.65 0.60 0.55 0.50 0.45 0.40 0.35 0.30 0.25 0.20 0.15 0.10 0.05 0.00 The set of efficient portfolios is approximately those portfolios with no more than invested in J&J